Embed Subsurface, Geoscience Data Visualization in Your Exploration, Drilling, and Production Applications
Develop advanced domain-oriented software and applications for web, desktop, and mobile with GeoToolkit’s customizable, high-performance 2D/3D tools. Create powerful visuals for your users — well log, seismic, schematics, real-time data, correlation, contour, reservoir, crossplot, charts, time series, maps, and more.

NEW Online Documentation:
Unlock the Full Potential of GeoToolkit.JS
Whether you’re building interactive well logs, seismic displays, or custom geospatial solutions, our documentation provides the resources you need to succeed.
- Clear and concise explanations: Learn the ins and outs of GeoToolkit.JS with easy-to-follow tutorials and examples.
- Comprehensive API reference: Explore every class, method, and property to build robust and tailored applications.
- Interactive demos: Get hands-on experience with live examples showcasing GeoToolkit.JS in action.
- CodeSandbox integration: Experiment and test your code in a live environment directly from our documentation.
What Is GeoToolkit?
Check out our latest GeoToolkit releases:
GeoToolkit.JS 2024.1
What's New:
Enhanced well log visualization, 3D capabilities, Online Documentation, and more with GeoToolkit.JS 2024.1
What's New:
Extended Python Wrappers: Python integration with GeoToolkit is now even more powerful and flexible, enabling seamless scripting and automation of workflows.
What's New:
Take advantage of the new NuGet packages (.nupkg) deployment, cobweb chart, and more.
Join the INT Developer Community!
INT is pleased to offer a comprehensive Developer Community which features online GeoToolkit documentation, demos, tutorials, training, Code Sandbox, a robust developer forum, and more! Open to licensed users of GeoToolkit.JS.
New Product Release: GeoToolkit 2024.0
Check out the full release notes to learn what’s new in GeoToolkit 2024, including improvements well log visualization, enhanced 3D capabilities, and expanded charting functionalities!
Access GeoToolkit.JS Documentation Online
Dive into our extensive online documentation and discover the full power of GeoToolkit.JS. Find detailed guides, tutorials, API references, Code Sandbox, and examples to accelerate your development of advanced geoscience visualization applications.
Powerful Domain Visualizations You Can Integrate
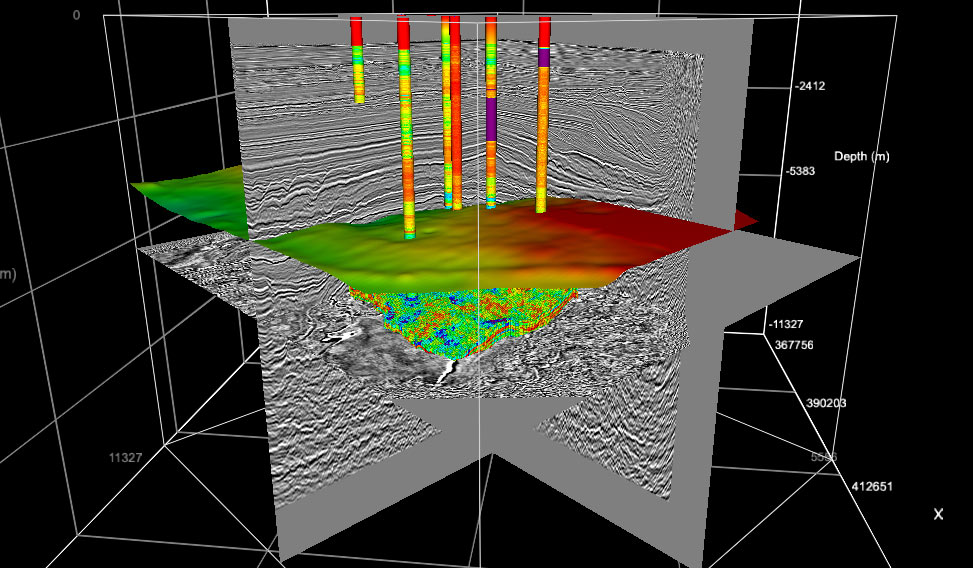
3D Rendering in HTML5
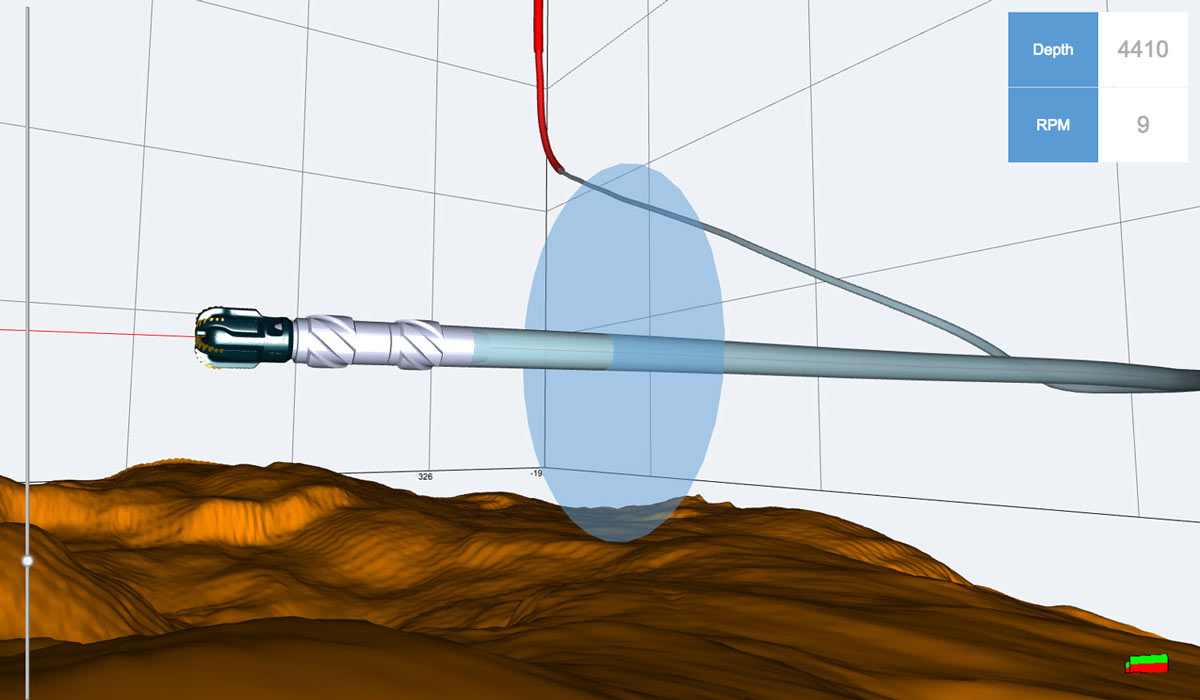
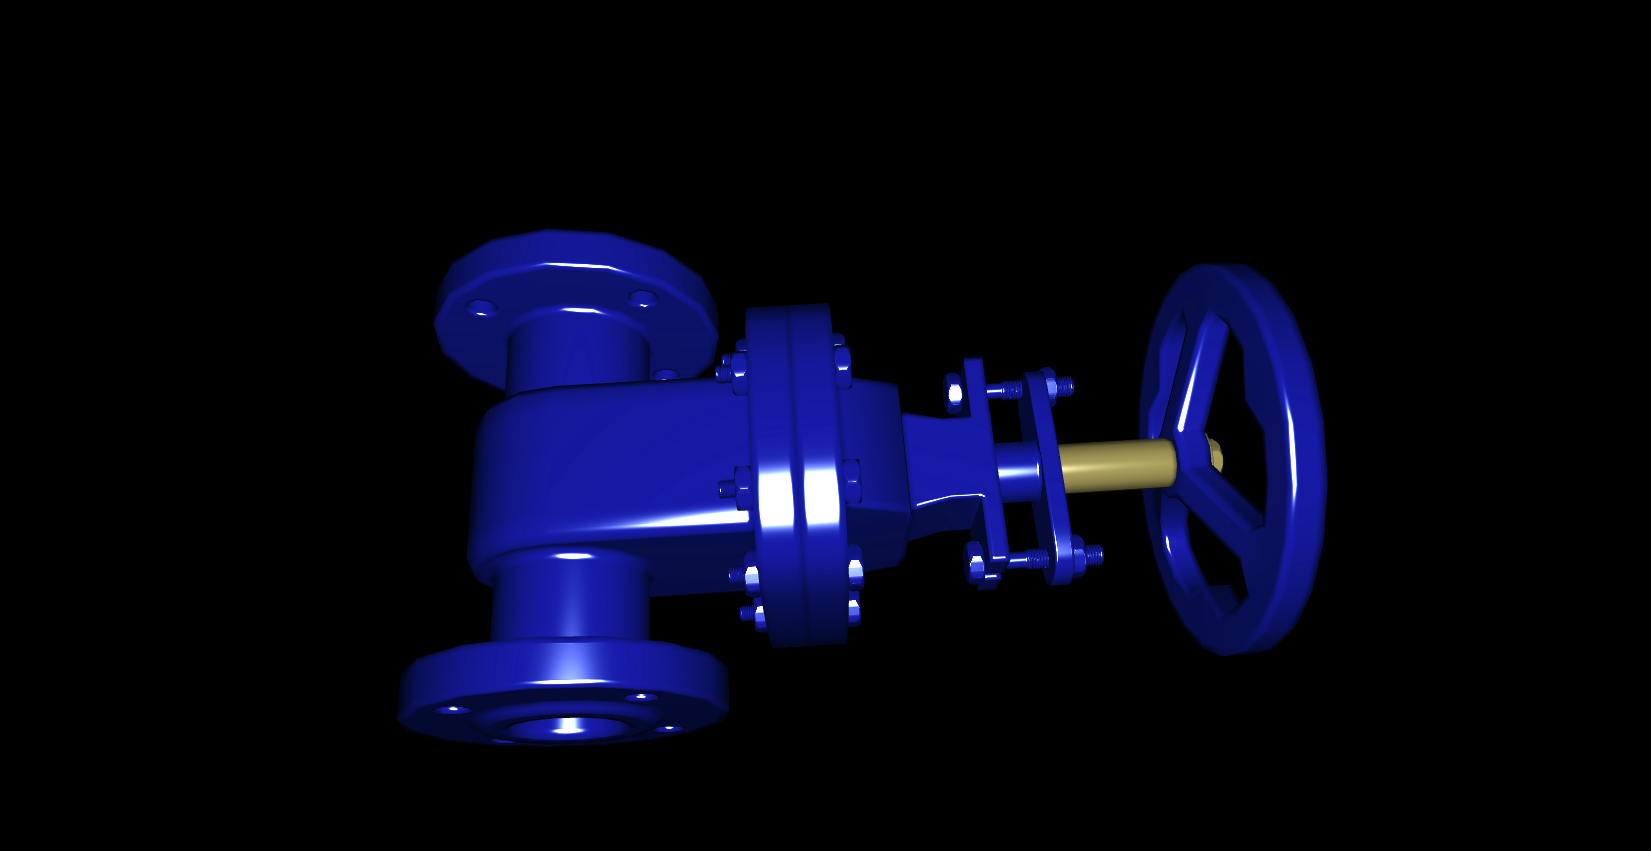
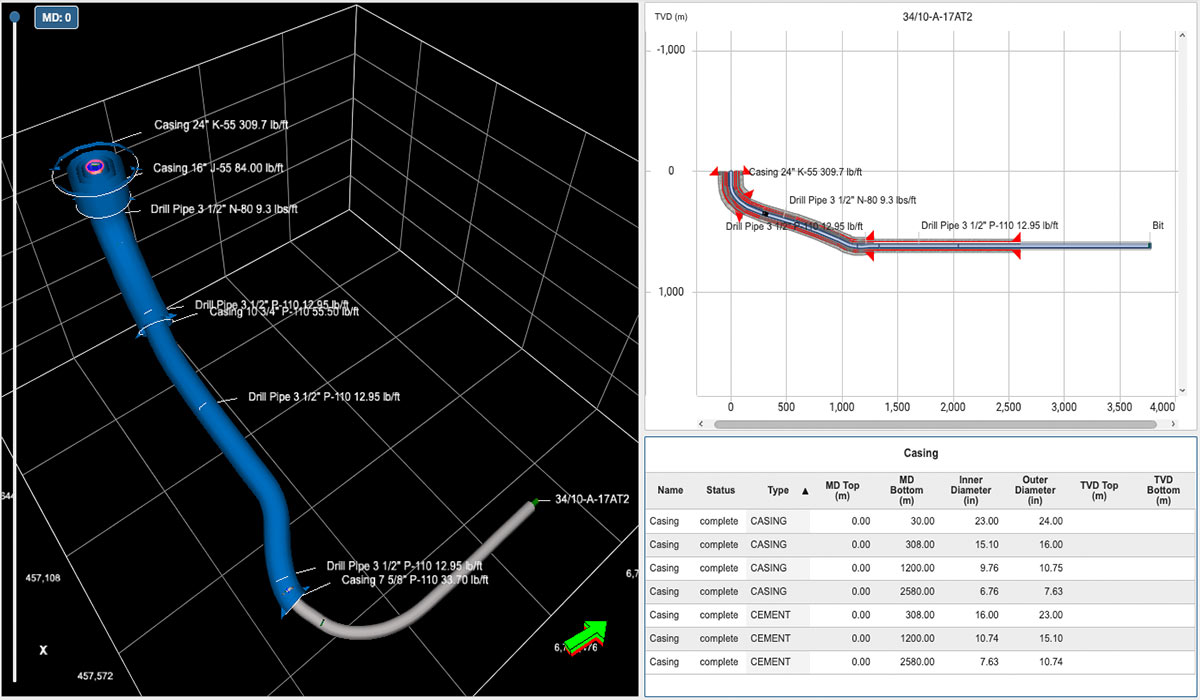
A feature-rich 3D library for developing professional applications in Oil & Gas, CAD, Engineering, and Mining. Display your seismic and reservoir data in 3D. The 3D plot uses WebGL technology to achieve GPU rendering in the browser.
More about 3D
Display Features
Compass
Three.js library integration v152
Different cameras
Well trajectory
Log curve: cylinder or 2D
Log fill
Array log
Well annotations
Vector object
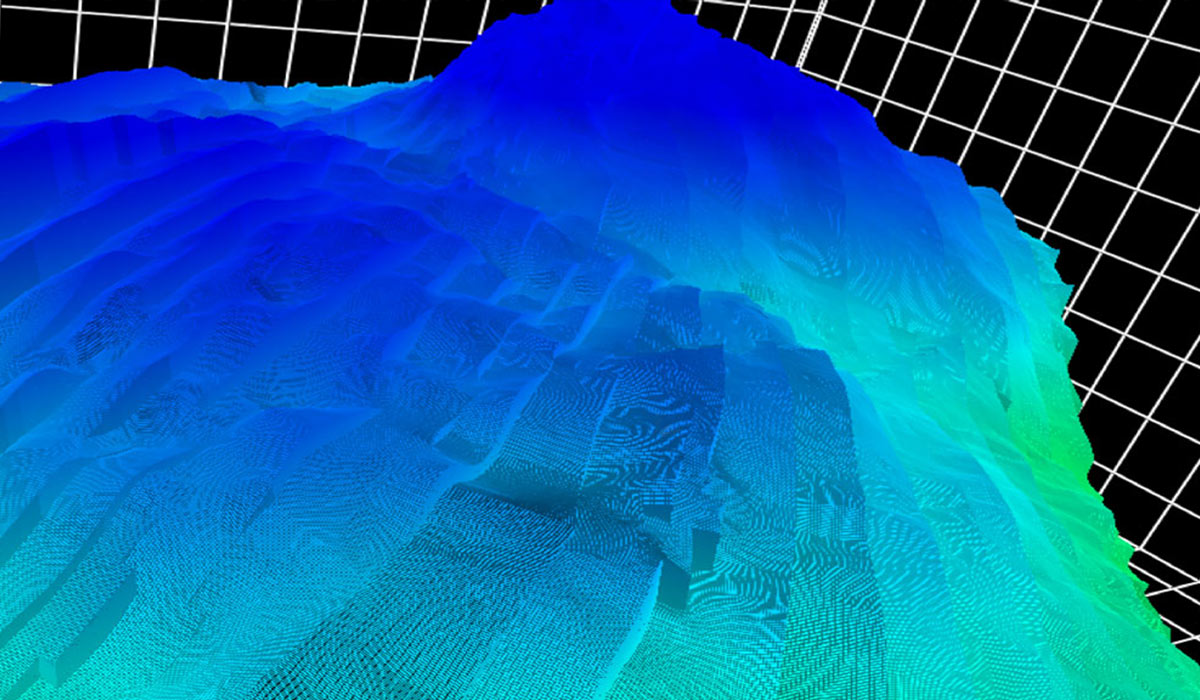
Surfaces
Highlight mode
Volumetric rendering
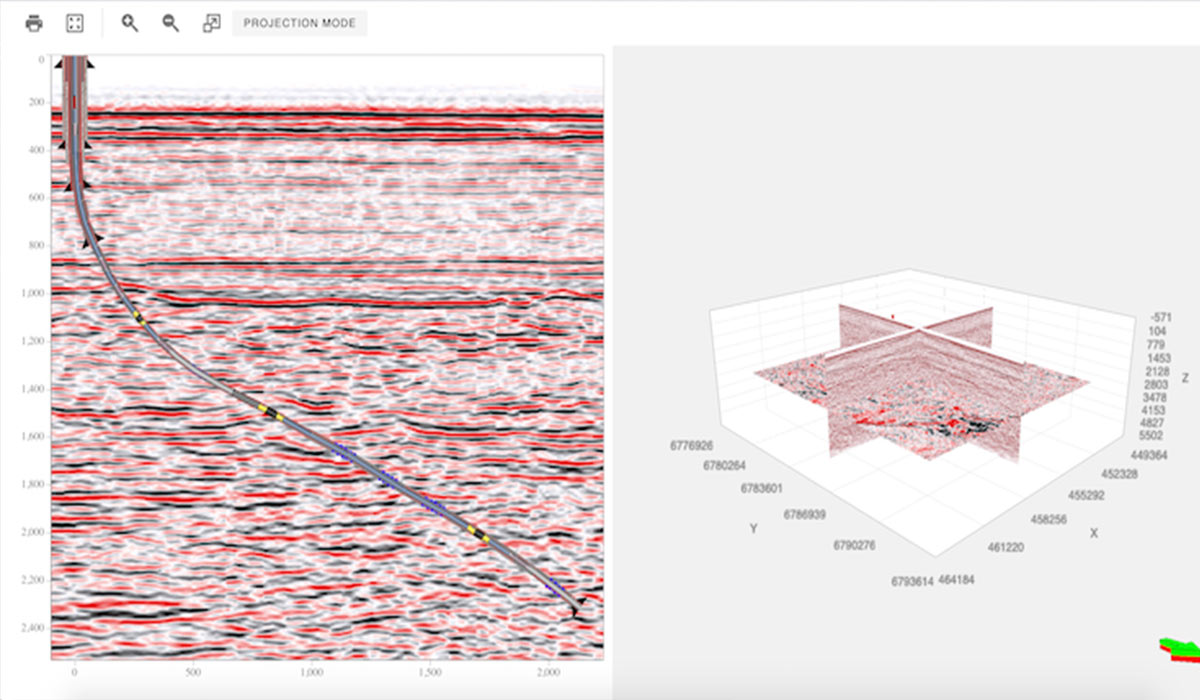
Seismic slices
Seismic overlays
Pointset (microseismic)
2D map
Animations
GigaGrid
Picking
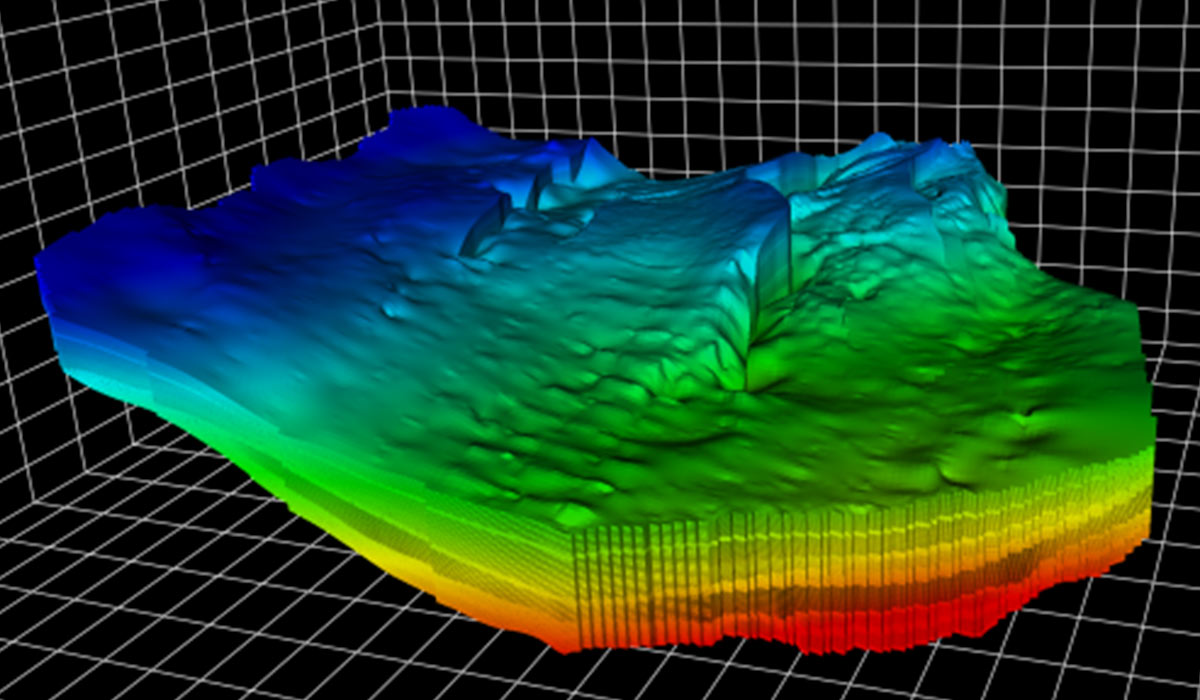
Reservoir grid
Schematics
WellLog array 2D
3D reservoir along trajectory
Clipping support of different objects
CAD files
Seismic volume and fence intersection support
ScatterPlot
3D shape highlighting
Contour 3D
Multi-lateral trajectory tube
Faults visualization surface
Projection widget
Grid surface loader and data type
Seismic fence intersection support
WellLog Array 2D
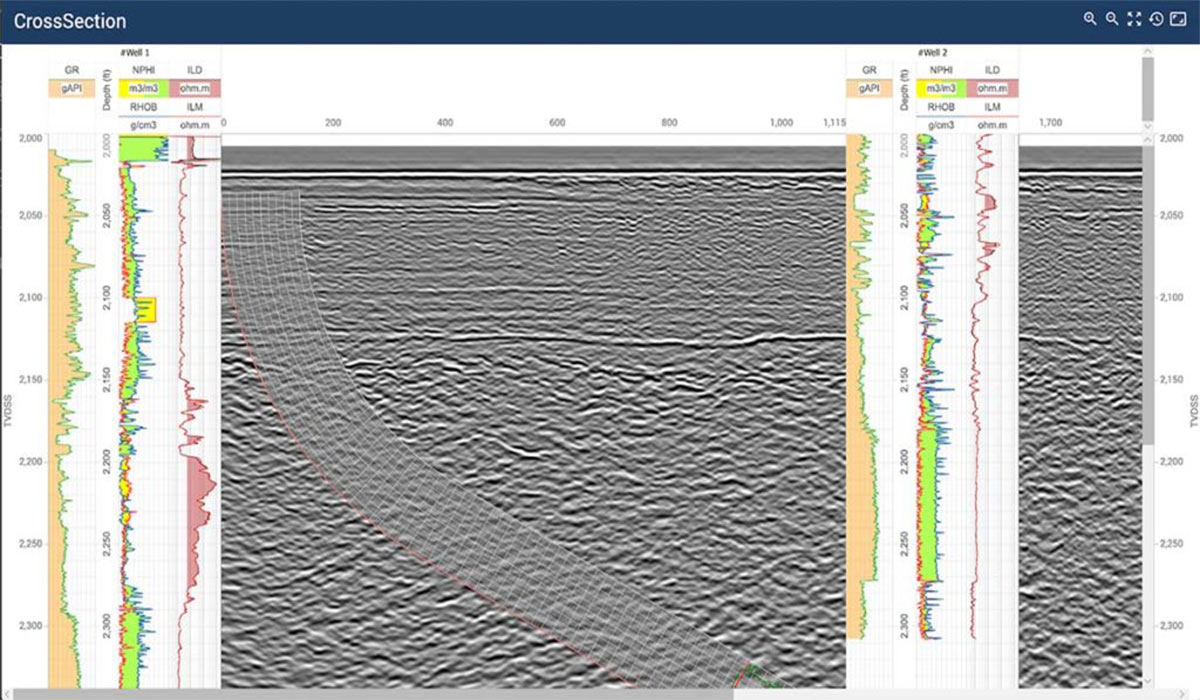
Well Log Viewer
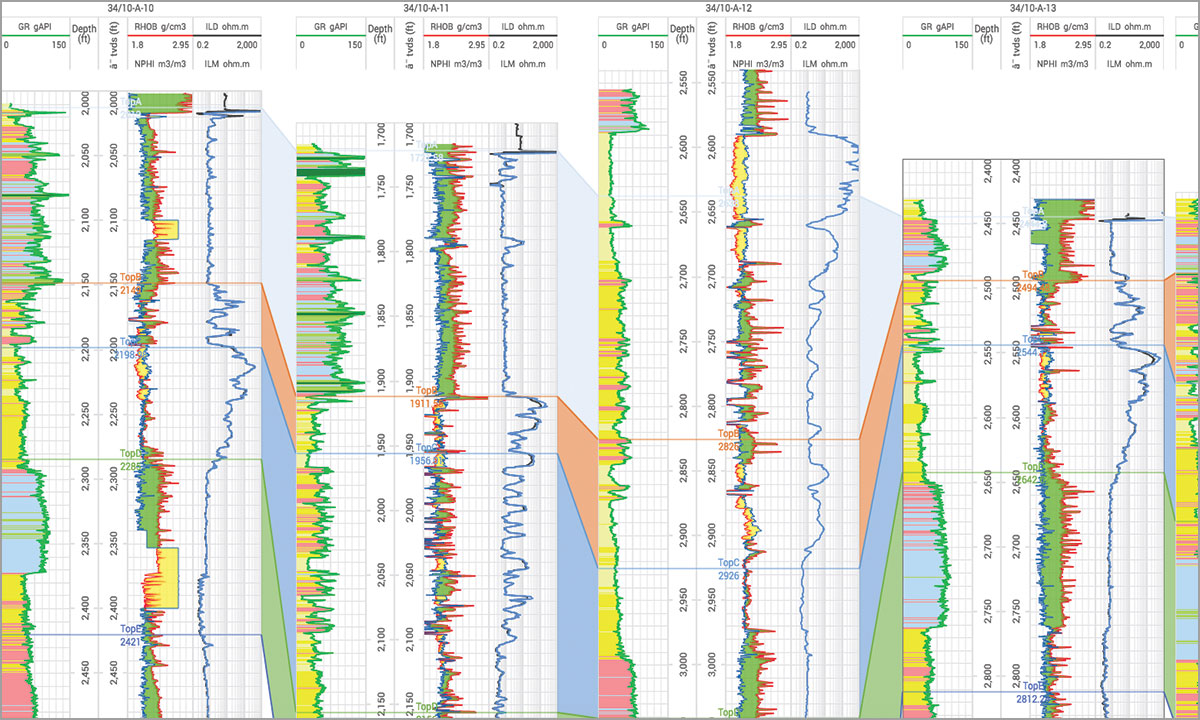
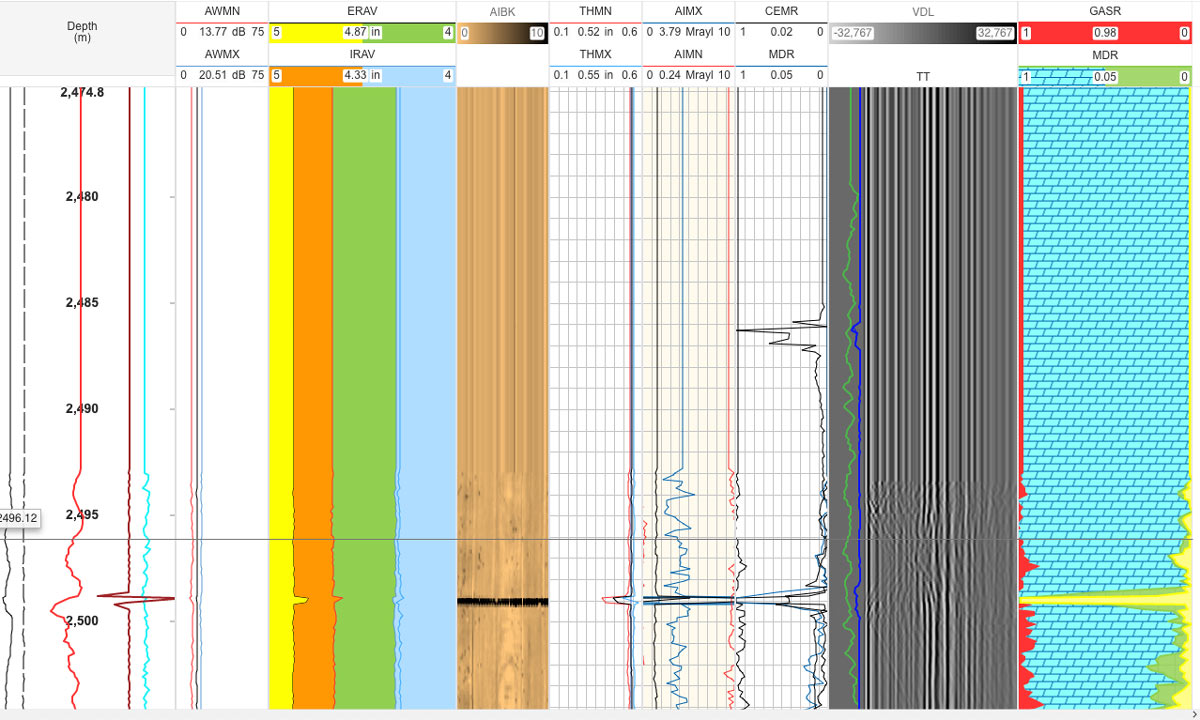
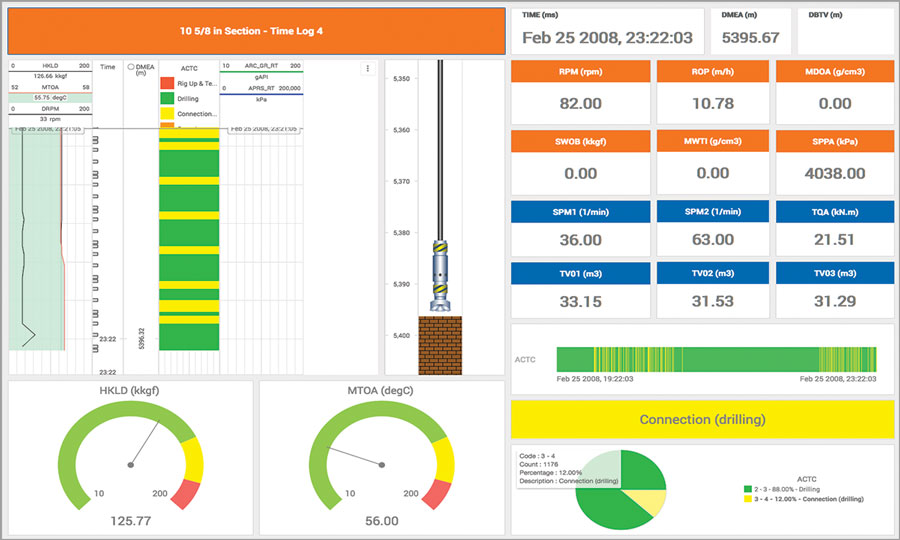
Build subsurface drilling, petrophysical analysis, or data management applications with single or multi-well displays that can correlate 1,000+ wells. Connect to real-time data such as WITSML and display horizontal, deviated, map, and 3D well logs.
More about Well Log Viewer
Display Features
Log curve
Discrete curve
Tick curve
Value curve
Gradient curve
Stacked curve
Fill between two curves or base line
Stacked fill
Gradient fill
Marker (tops)
Lithology
Annotations
Array log
Tadpole
Rose diagram
Density log
Image log
Raster log
Core image
Cross-section*
Waveform (requires seismic module)
Custom/third-party visuals
Cutoff log
Micropositions
Display single well log data
Vertical or horizontal view
Template support
Interactive tool support
Time or depth-based data
Real-time support
PDF printing
Custom headers and footers
Cursor tracking tool
Zones support
Tracks
Linear
Logarithmic
Axis
Navigation
Tangential
Split track
View
Deviated view of existing visuals
Attached header / footer
Fills to accumulation cycle visual
Correlation Widget
Display multiple wells
Supports header/footer
Display multiple wells
Option to share the same template between wells
Horizontal mode
Lazy loading for proxy well
Attached / deatched headers and footers
Proportional / equal distance spacing between wells
LAS, DLIS, WITSML, OSD
Rest API
Data Object Model
Headers
Curve
Fill
Lithology histogram
Track
Composite
Collapsed
Custom/third-party headers
Cursor tracking
Miscellaneous
Responsive style (level of details)
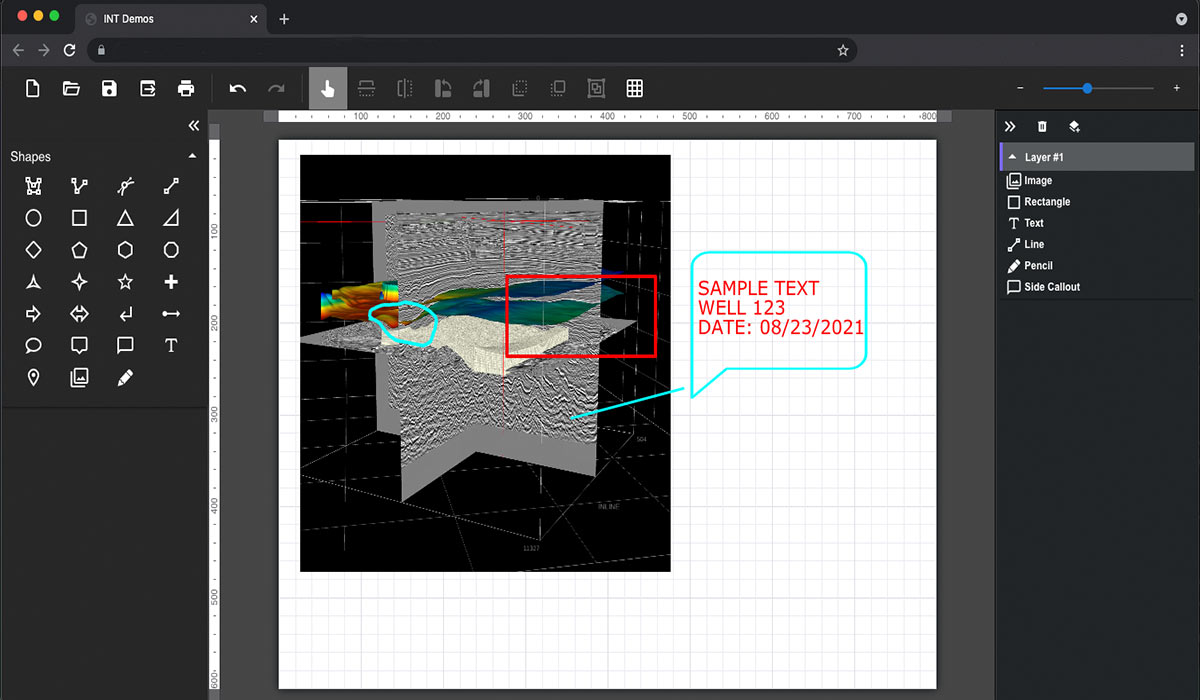
Annotation overlay for widgets
LAS 2.0 writer
LAS 3.0 writer
Tools
Ghost tool (linear and deviated tracks)
Tops editor
Curve and marker editor
Drag and drop tool
Lithology editor
Paint annotations
Symbols mode to LogMudLogSection
Inline editing of annotations
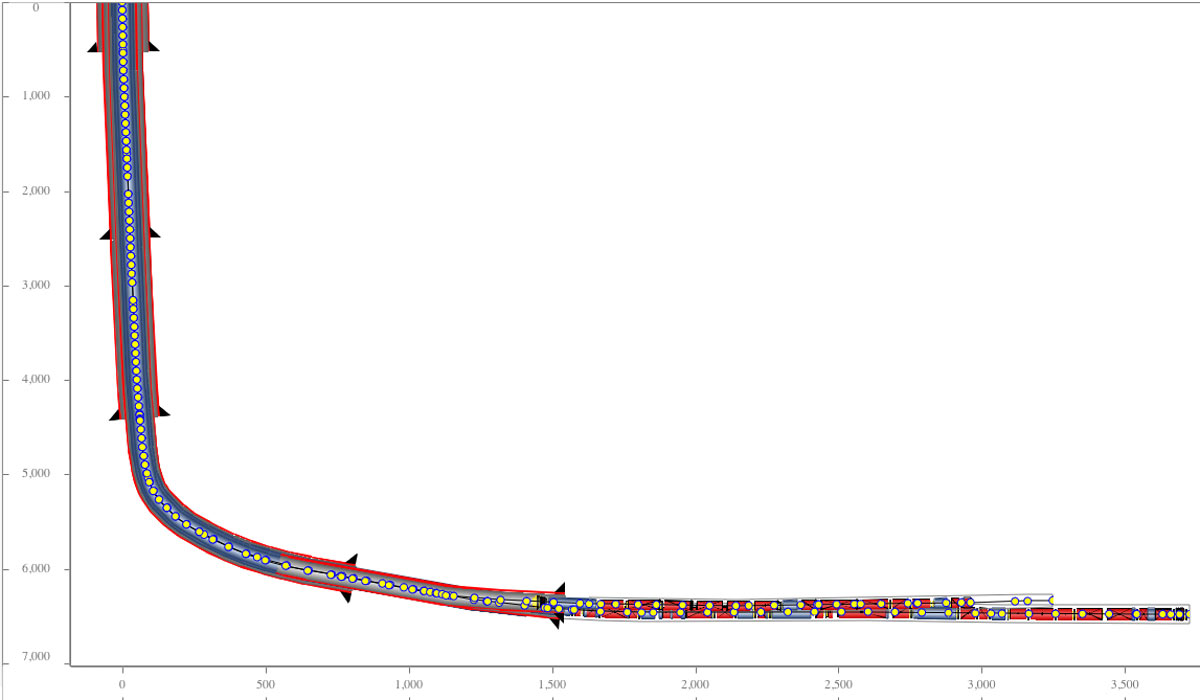
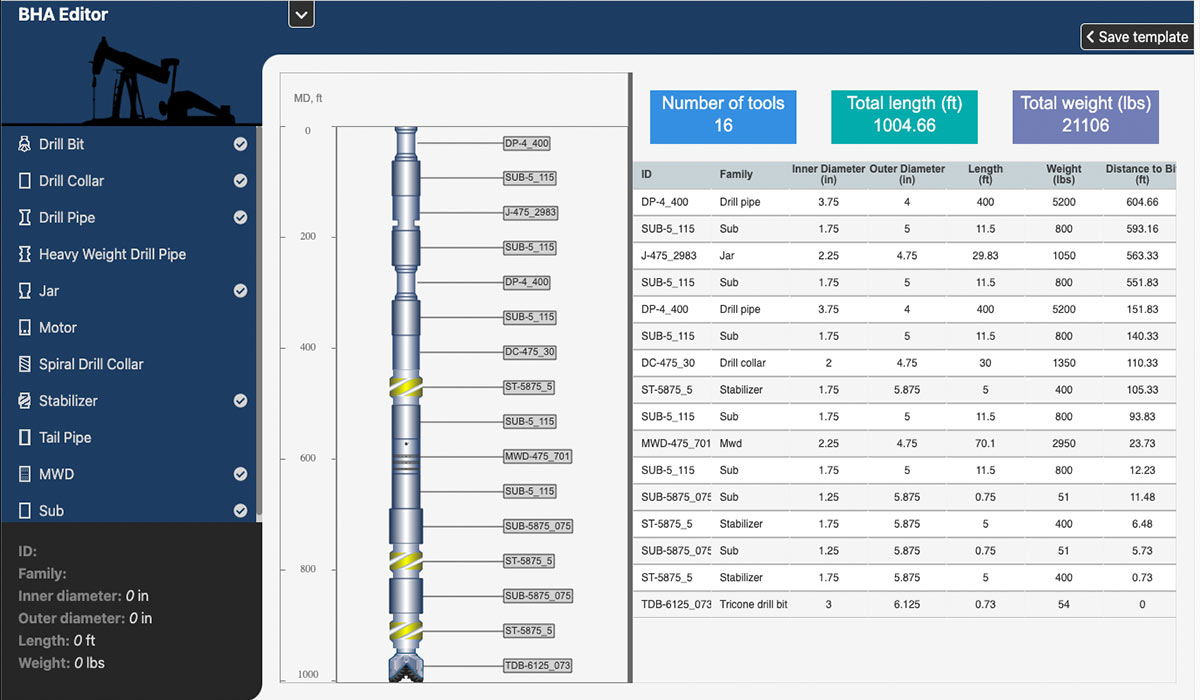
Well Schematics
Visualize wellbore, downhole equipment, including drilling, completion, production, and workover operations. Display and edit BHAs and vertical, deviated, multilateral, and horizontal wells.
More about Well Schematics
Linear or compressed
Vertical or deviated
L-shaped
Multi-string
High-quality SVG symbols
Labeling and annotations
Real-time
Fluid levels
Lithology
Well log track
Options to integrate with your own schematics elements library (vector or raster images)
Widget schematic
L-Shape schematic widget
Multilateral schematics
Deviated schematics
Tooltip tool
Dual schematics widget
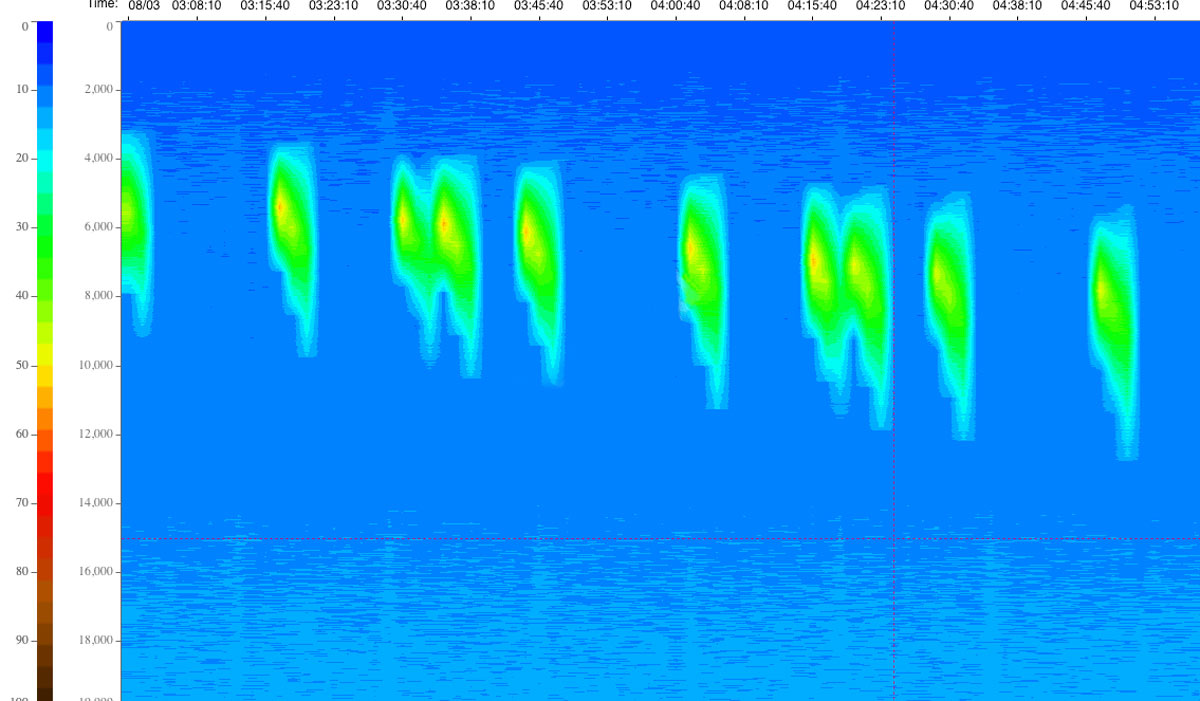
Seismic Visualization
View, interpret, edit, and process 2D/3D seismic data with integrated components to overlay annotation, picks, logs, or contours. View broadband seismic, 3D seismic, or view seismic data in real time. Supports server-side and client-side rendering.
More about Seismic Visualization
Display Features
Wiggles anti-aliasing
Positive and negative fill
Variable density with custom color map
Trace headers
Variable trace spacing
Waveform patterns
Decimation and clipping
Vertical or horizontal view
Trace headers table
Time slices in base maps
Auxiliary graph
Base map
Overlay support
Variable trace spacing
Horizon picking tool
Transparency support for each type of density, fills, traces and traces by status
Seismic widget
Seismic widget with trace header table
Seismic widget with auxiliary graph
Trace headers table view
Annotations overlay
Data Formats
SEG-Y
Memory data source
Remote data source
INTGeoServer integration with trace decimation and data compression
Custom source
IVAAP integration with decimation and data compression
Azure SEG-Y reader
IVAAP integration with decimation and data wavelets based and ZFP compression
IVAAP Backend and INTGeoServer 3.0+ Backend
Data Processing
Interpolation (linear, quadratic, cubic, step)
Normalization (maximum, average, RMS, specific limits)
Taper filter
Automatic gain control
Real-Time Support
Real-time traces
Waveform
DTS acquisition
Shot monitoring
ZFP decompression for IVAAP backend
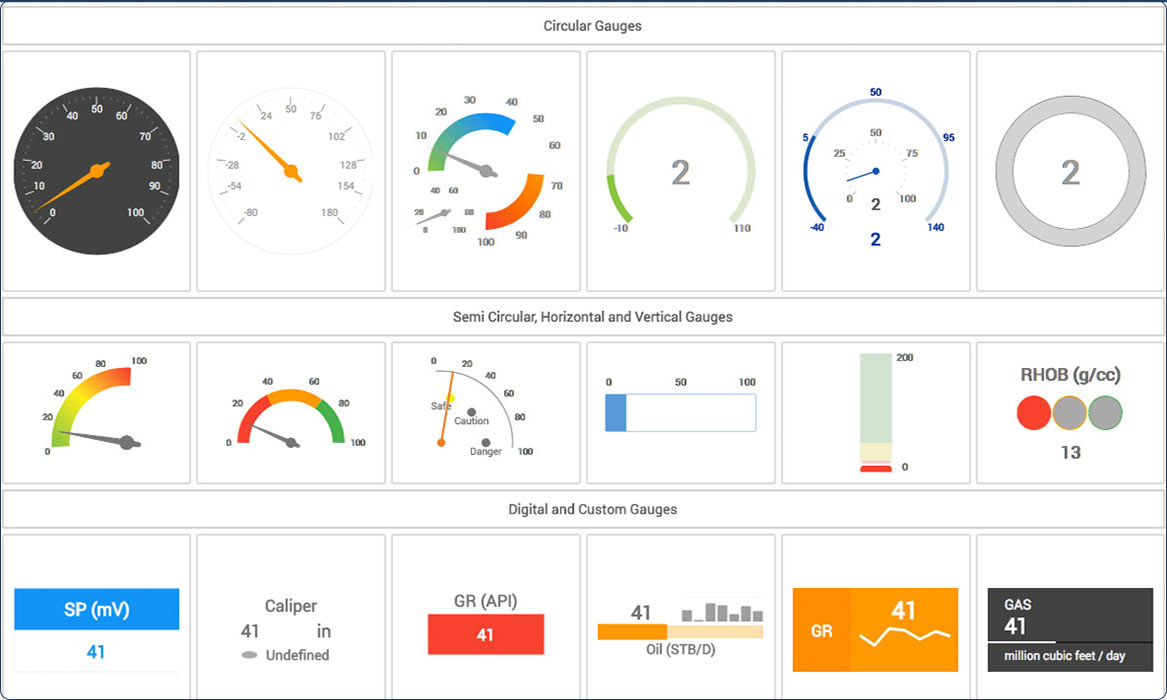
Gauges and Alarms
Combine textual, radial, and linear gauge types with alarms to notify users when values reach pre-defined thresholds in real-time monitoring applications.
More about Gauges and Alarms
Display Features
Half-circular
Linear
Numeric
Digital
Traffic
Custom gauges
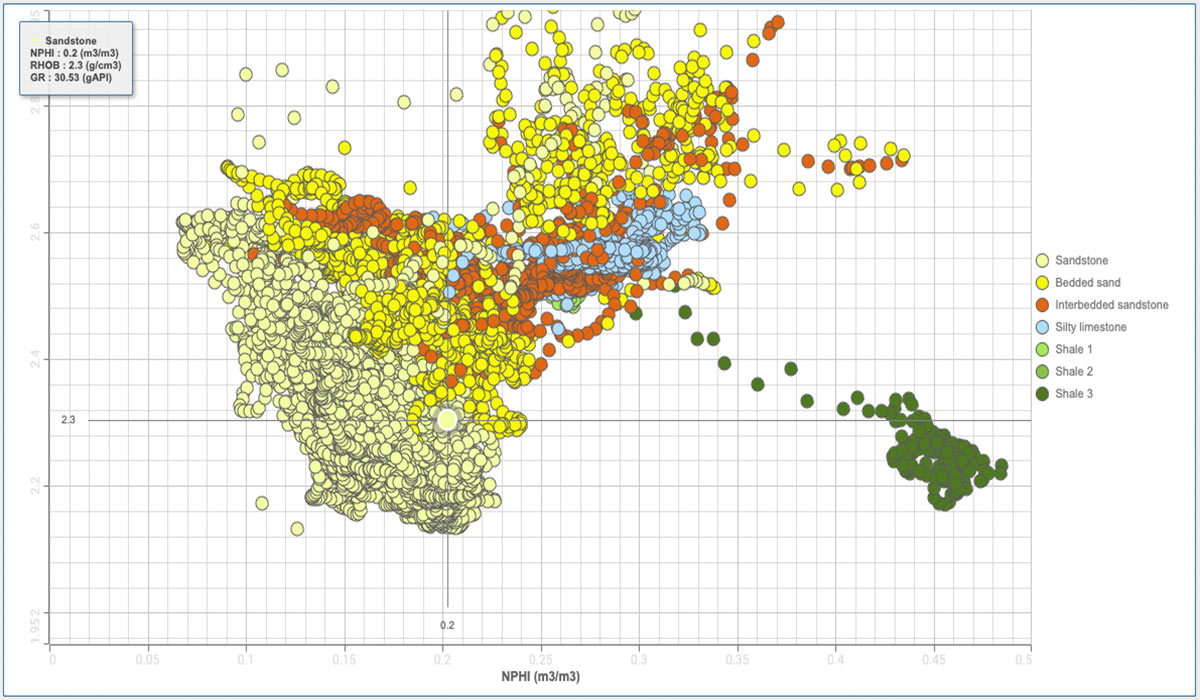
Crossplot
Compare measurements along two or more axes with this 2D scatter plot visualization. Customize your graph to display reservoir characterization, seismic, or to interpret geophysical, geochemical, and hydrologic data. GeoToolkit offers both linear and logarithmic.
Contour
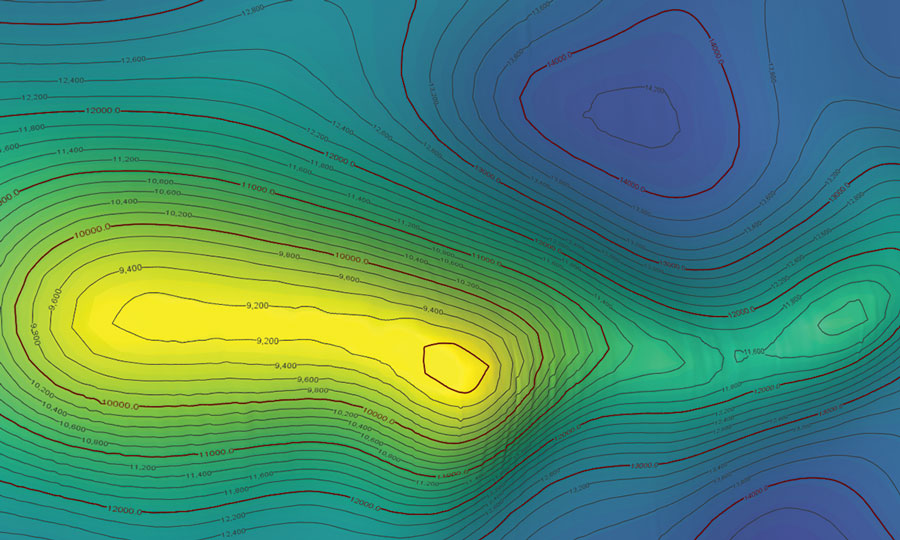
Display a gridded or triangulated surface as a contour. Customize the frequency and appearance of contours, annotations, and colors.
More about Contour
Display Features
2D/3D
Isolines with labels
Smoothing
Label collision detection
Colormap-based fill
Faults
Overlays
Types
Regular rectangular grid
Arbitrary triangular grid
Gridding algorithms: Kriging and ThinPlate
Charts and Maps for Business & Science
Create stunning charts, graphs, and maps with minimal programming effort with our extensive set of samples and tutorials. Extend existing charts or create new ones through a powerful API.
More about Charts and Maps
Types
Bar
Box plot
Bubble
Donut*
Histogram
Table
Pyramid
Line
Density
Polar
Radar
Rose
Stacked area
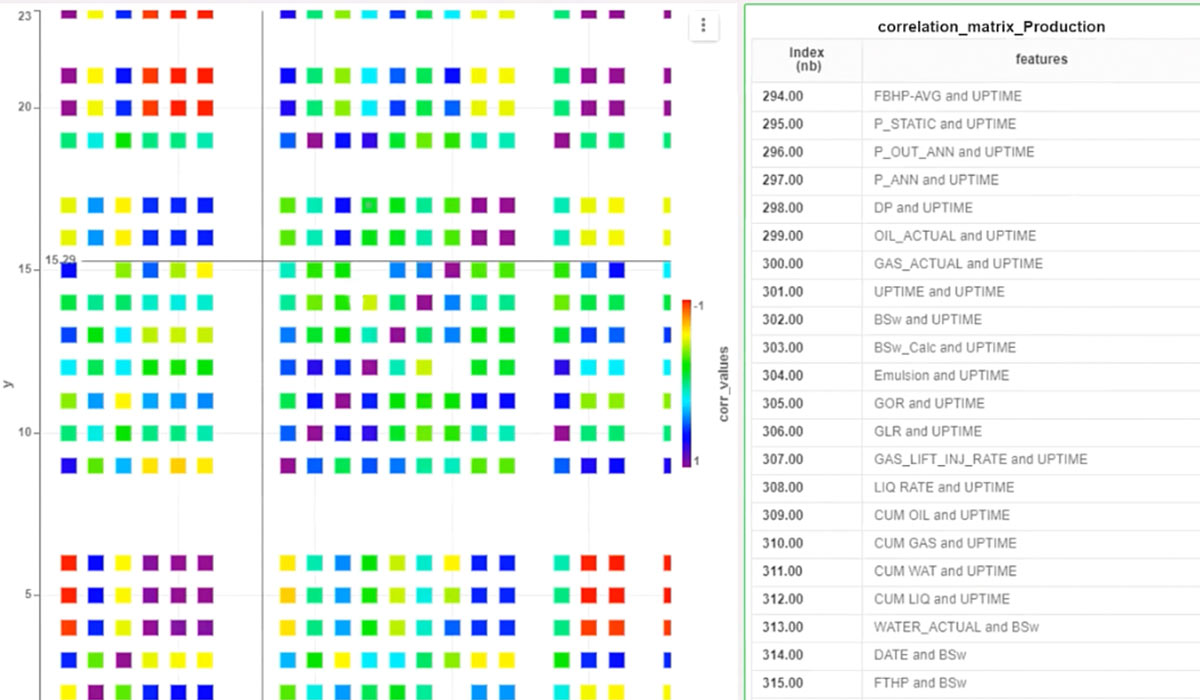
Cross-plot
Tornado
XY Line
Heat map
Multiseries
Line chart colored by other variable
Error Chart (Uncertainty Chart)
Flow charts
Multi-histogram
Linear and non-linear regression
Regression line
Cross-section
Real-time support for all charts & widgets
Ternary chart
Chart widget
Large Volume Rendering with OpenGL
Create high-quality, high-performance visualizations of very large datasets, including billions of cells (gigagrid), using our library of 3D components. Perfect for interpretation, 3D tool design validation, reservoir rendering, analysis, and QC. Provides volumetric rendering capabilities (including external renderers like Intel OSPRay, NVIDIA IndeX).
More about Large Volume Rendering
Display Features
3D multi-view
Default controllers
Lights (Directional, Spot, Point)
Interactive picking
Adaptive axis and grid
Standard shapes (Cone, Sphere, Box, Surface, Triangle set, strip and fan)
Button and icon in the 3D view
Vectors (linear and circular)
Triangulated surface with attribute values
Pointset with multiple attributes
Polyline with attribute values
Report Builder
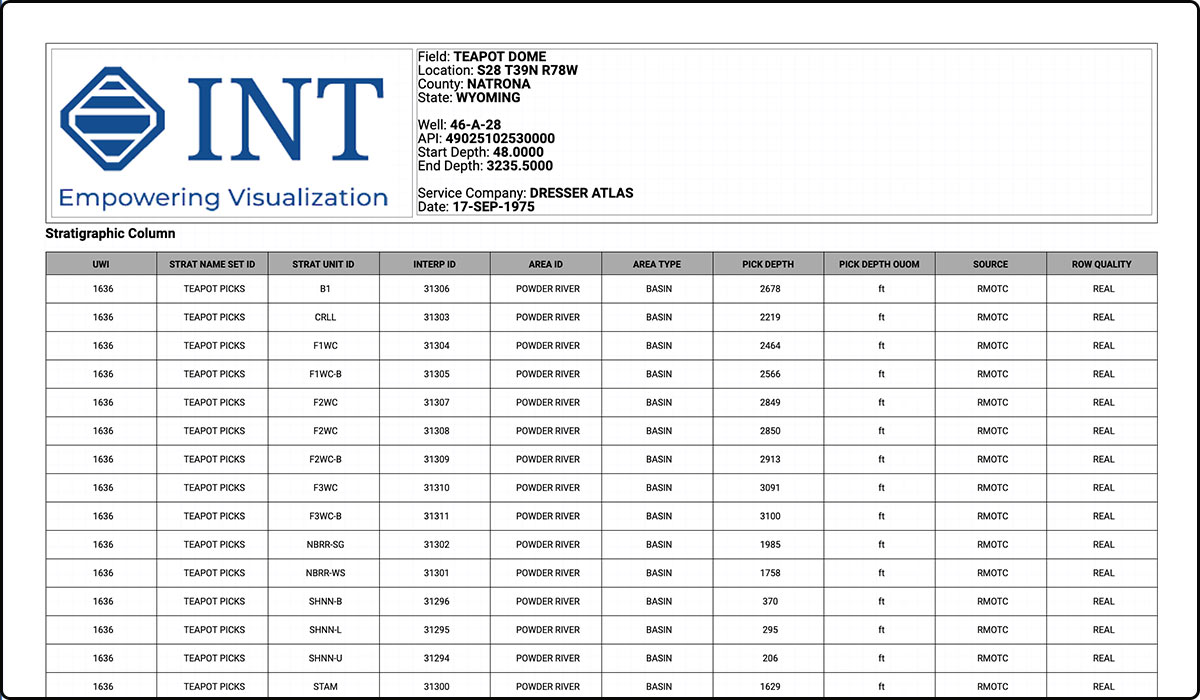
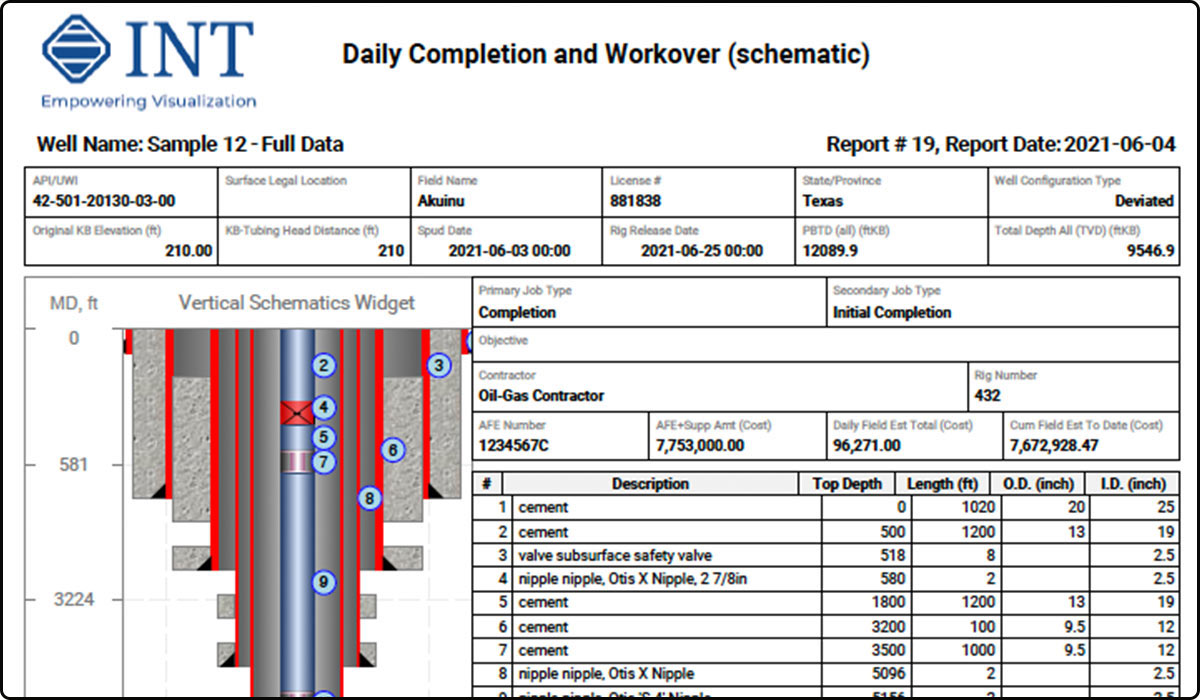
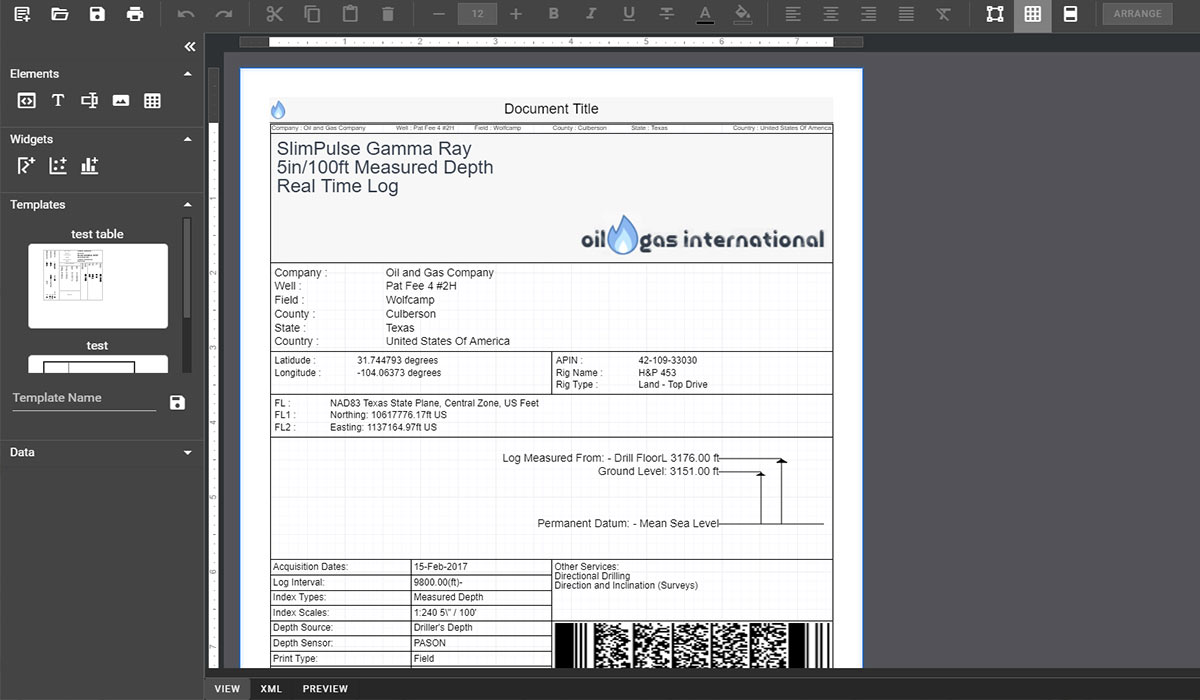
Create PDF reports with multiple widgets, minimizing the time it takes to build custom log headers. Integrate a custom application and connect to data. Available as an add-on that’s ready-to-go or code your solution by hand.
More about Report Builder
Display Features
Document Preview
PDF
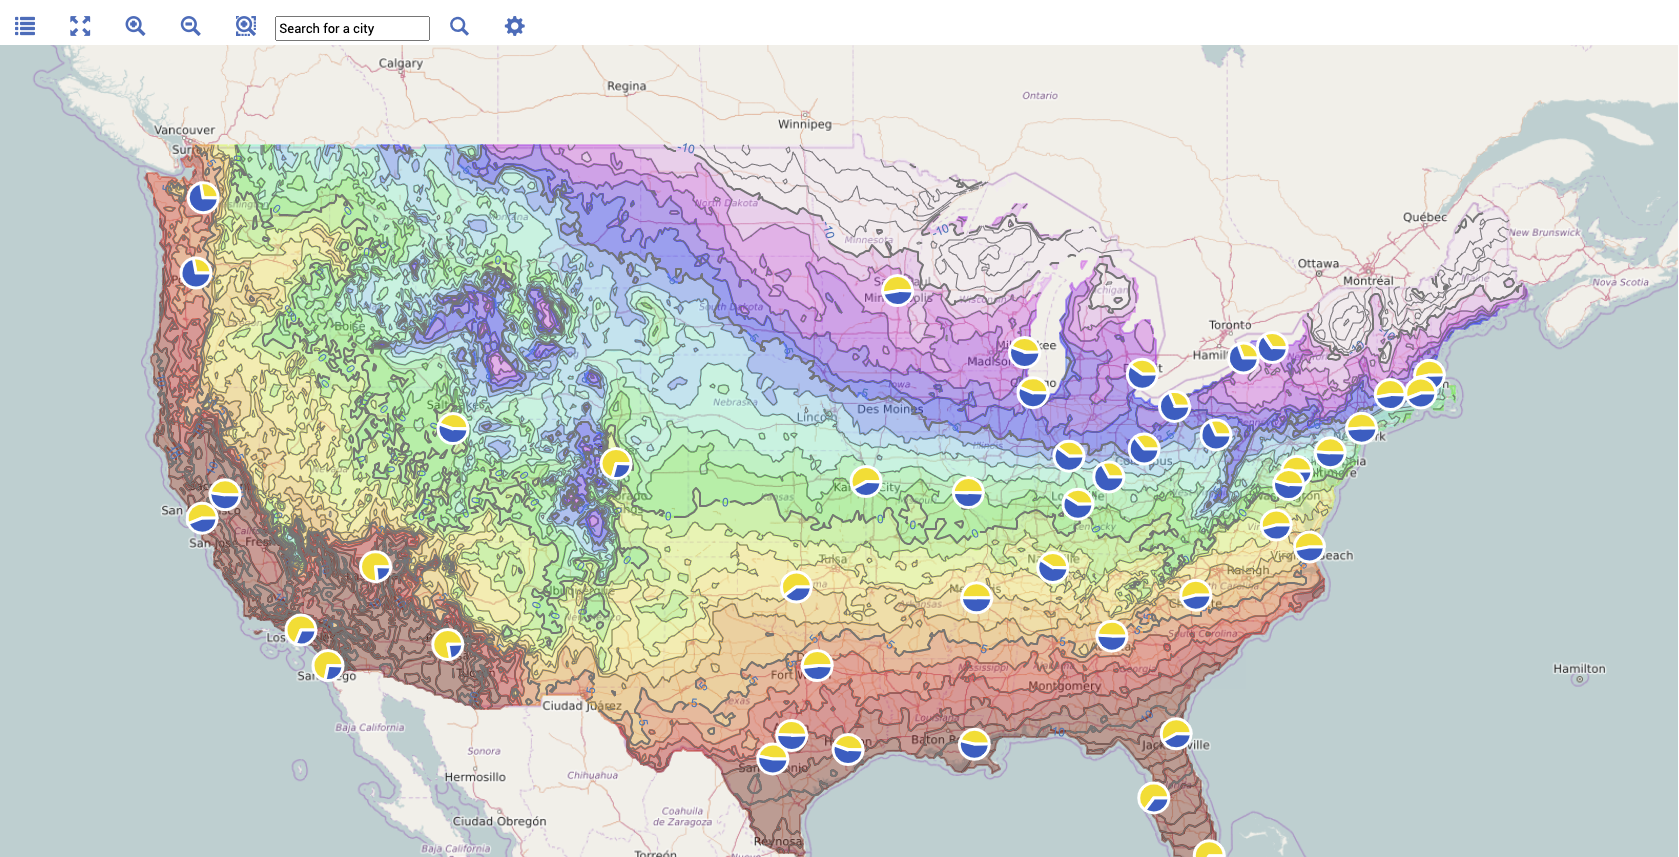
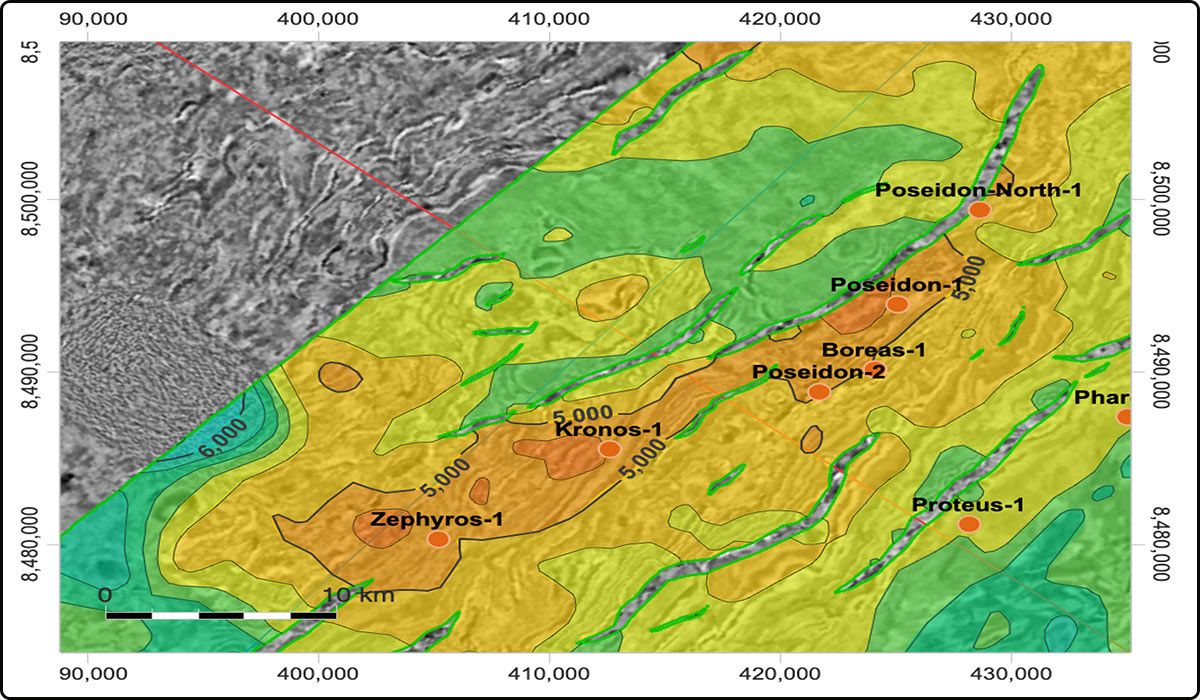
Maps
GeoToolkit supports most maps services, such as ArcGIS, ESRI, OpenStreetMap, and more.
More about Maps
Display Features
WMTS services: Google, MapQuest, ESRI, OpenStreet map, Bing
ArcGIS GeoServices (feature, map service)
ArcGIS web map
ArcGIS query/identify/ legend API support for ArcGIS servers
GeoJSON support
KML support
Stream service
CSS
Limited Error Raster Compression format
Coordinate systems
Vector tiles
Overlays
Symbols aggregation
Symbol aggregation as bubble chart
Tool to measure distances and area
GPX format support
Opt. UI floating control
Infinite horizontal scroll
Contour layer (requires Contour module)
Heatmap layer
GeoTIFF support
Webmap support
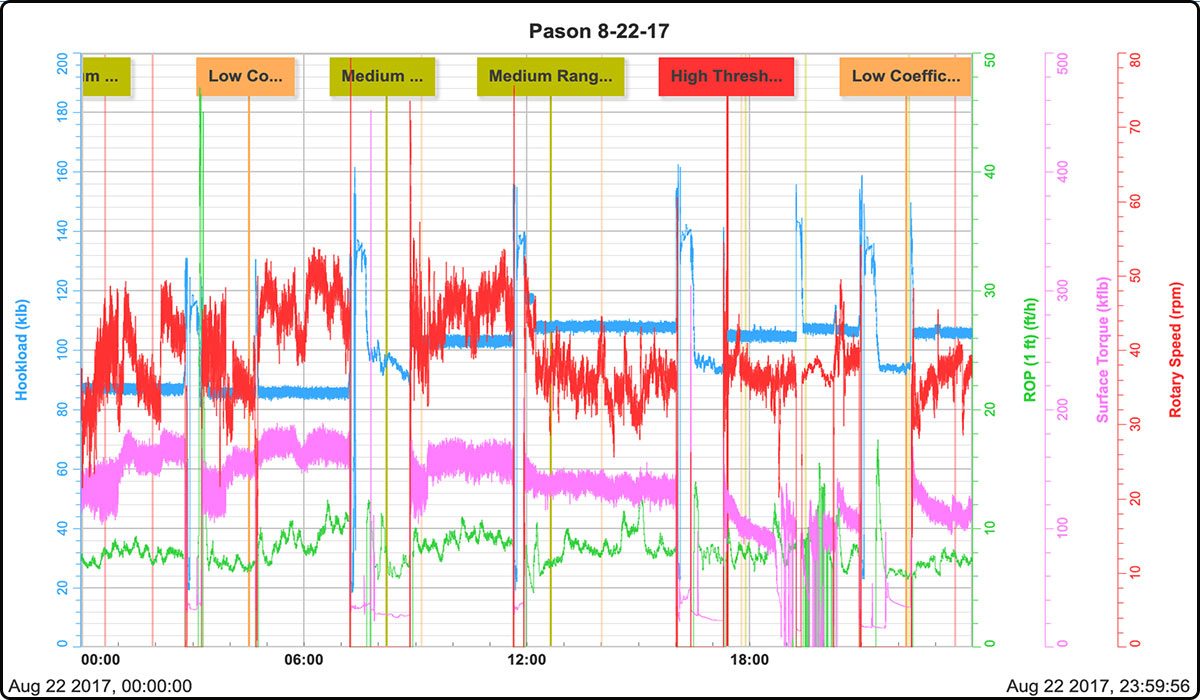
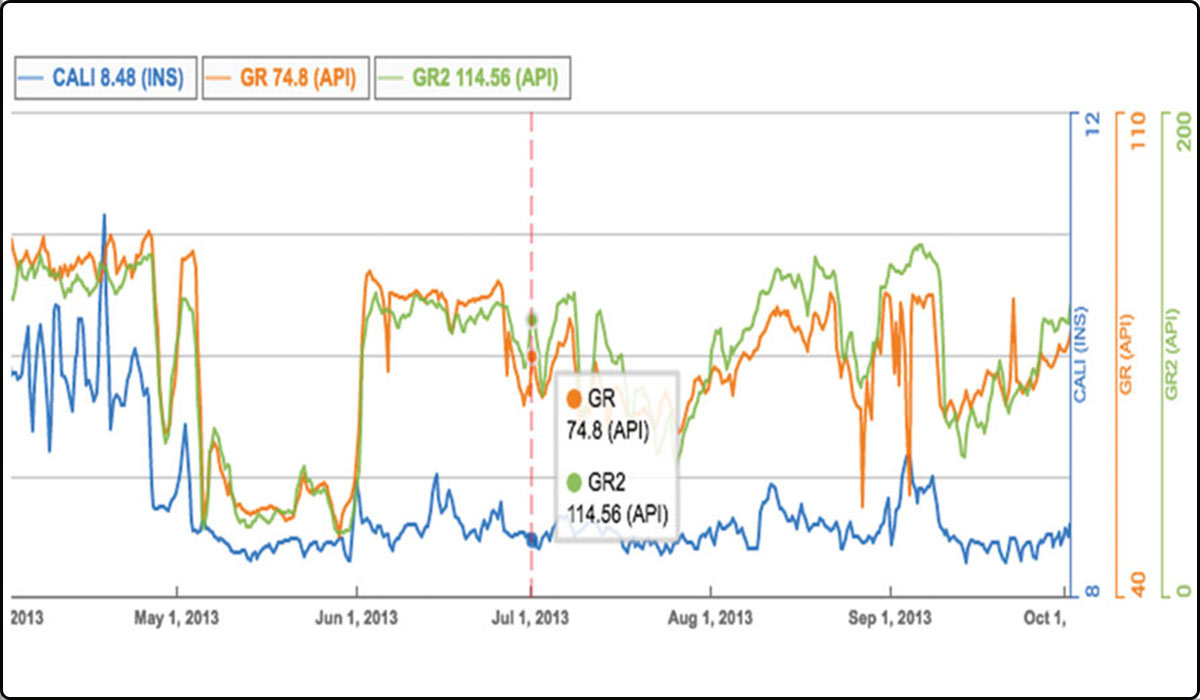
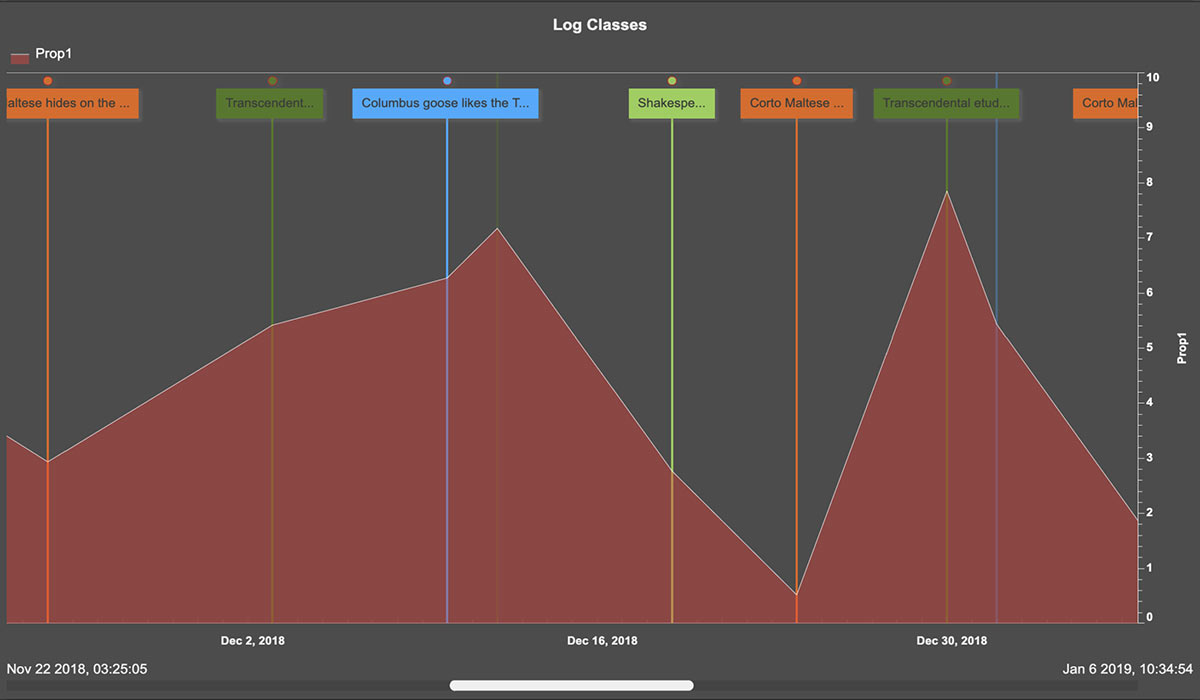
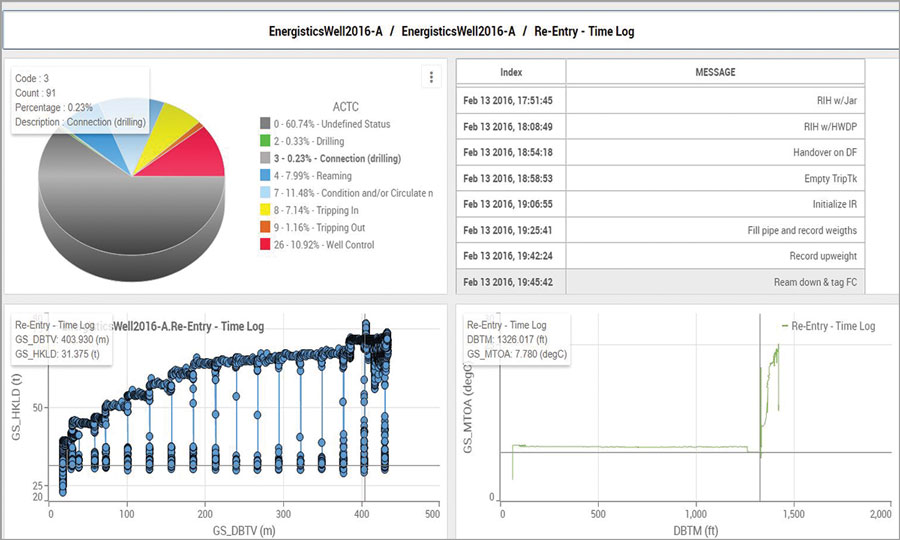
Time Series
Visualize multiple time series data with annotations and overlays for easy correlation and analysis in normal, stacked, or percentage mode.
More about Time Series
Display Features
Annotations
Overlays
Fill/Fill between
Interpolation modes
Micro positions
Zoom behavior
Stacked / percentage mode
KEY FEATURES
Flexible Development Framework: GeoToolkit supports frameworks like Angular, React, and Vue and languages like Javascript ES6 and TypeScript.
Language Agnostic: GeoToolkit is available in HTML5, Microsoft® .NET, Java, or C++ with QT. We even support legacy systems.
Continuous innovation and emerging new technology: We strive to support our customers’ needs
Industry-leading support: 24/7 email and phone support plus robust Developer Community with full product documentation, Code Sandbox, and developer forum.
Advanced Data Compression: Built specifically for the geoscience industry, our on-the-fly data compression handles large datasets easily.
Build Your Way
With GeoToolkit libraries and widgets, you have the flexibility to either simply plug and play high-performance functionality with one line of code or build an application from scratch, selecting and customizing libraries to fit your needs.
TESTIMONIALS
“Thanks to PressureDB and its standard format, our data is centralized, with guaranteed quality and stability. Its friendly and responsive web interface ensures easy access for Total’s geoscientists worldwide.”
Ming Yang, Formation Tester Specialist, TotalEnergies
“Without GeoToolkit, we wouldn’t be where we are right now. We have high expectations that this tool will become the standard and that we will be able to accomplish a lot with this tool. There’s nothing in the market like this right now.”
Francisco Caycedo, Regional Director, Latin America, Cayros
Technical Specs
SEG-Y
SEGD
LAS
DLIS
Bitmaps (BMP, JPG, GIF, PNG, TIFF, etc.)
EMF
SVG
CGM
2D/3D
WellLog, including deviated wells
Seismic, including cross-sections
Well Schematic, including multilateral schematic
Contour view
Charts, gauges, time series
Want to see the full list of GeoToolkit capabilities? Check out our Features Map below!
FAQ
Which frameworks does GeoToolkit support?
GeoToolkit supports React, Angular, and Vue.
Can I use your JavaScript libraries with my existing application?
Is it cheaper to buy GeoToolkit or build an application from scratch?
Which data providers can connect with GeoToolkit?
TRY GEOTOOLKIT FREE FOR 30 DAYS
Request a free 30-day trial of GeoToolkit to see for yourself what it can do.
![[GeoToolkitJS.] Welllog [GeoToolkitJS.] Welllog](https://www.int.com/wp-content/uploads/2023/05/GeoToolkitJS.-Welllog.jpg)
![[GeoToolkitJS.] WellLog & Schematics_gauges and alarm [GeoToolkitJS.] WellLog & Schematics_gauges and alarm](https://www.int.com/wp-content/uploads/2023/05/GeoToolkitJS.-WellLog-Schematics_gauges-and-alarm.jpg)
![[GeoToolkitJS.] Crossplot [GeoToolkitJS.] Crossplot](https://www.int.com/wp-content/uploads/2023/05/GeoToolkitJS.-Crossplot.jpg)
![[GeoToolkitJS.] Contour [GeoToolkitJS.] Contour](https://www.int.com/wp-content/uploads/2023/05/GeoToolkitJS.-Contour.jpg)

![[GeoToolkitJS.] Map2 [GeoToolkitJS.] Map2](https://www.int.com/wp-content/uploads/2023/05/GeoToolkitJS.-Map2.jpg)
![[GeoToolkitJS.] Map [GeoToolkitJS.] Map](https://www.int.com/wp-content/uploads/2023/05/GeoToolkitJS.-Map.jpg)
