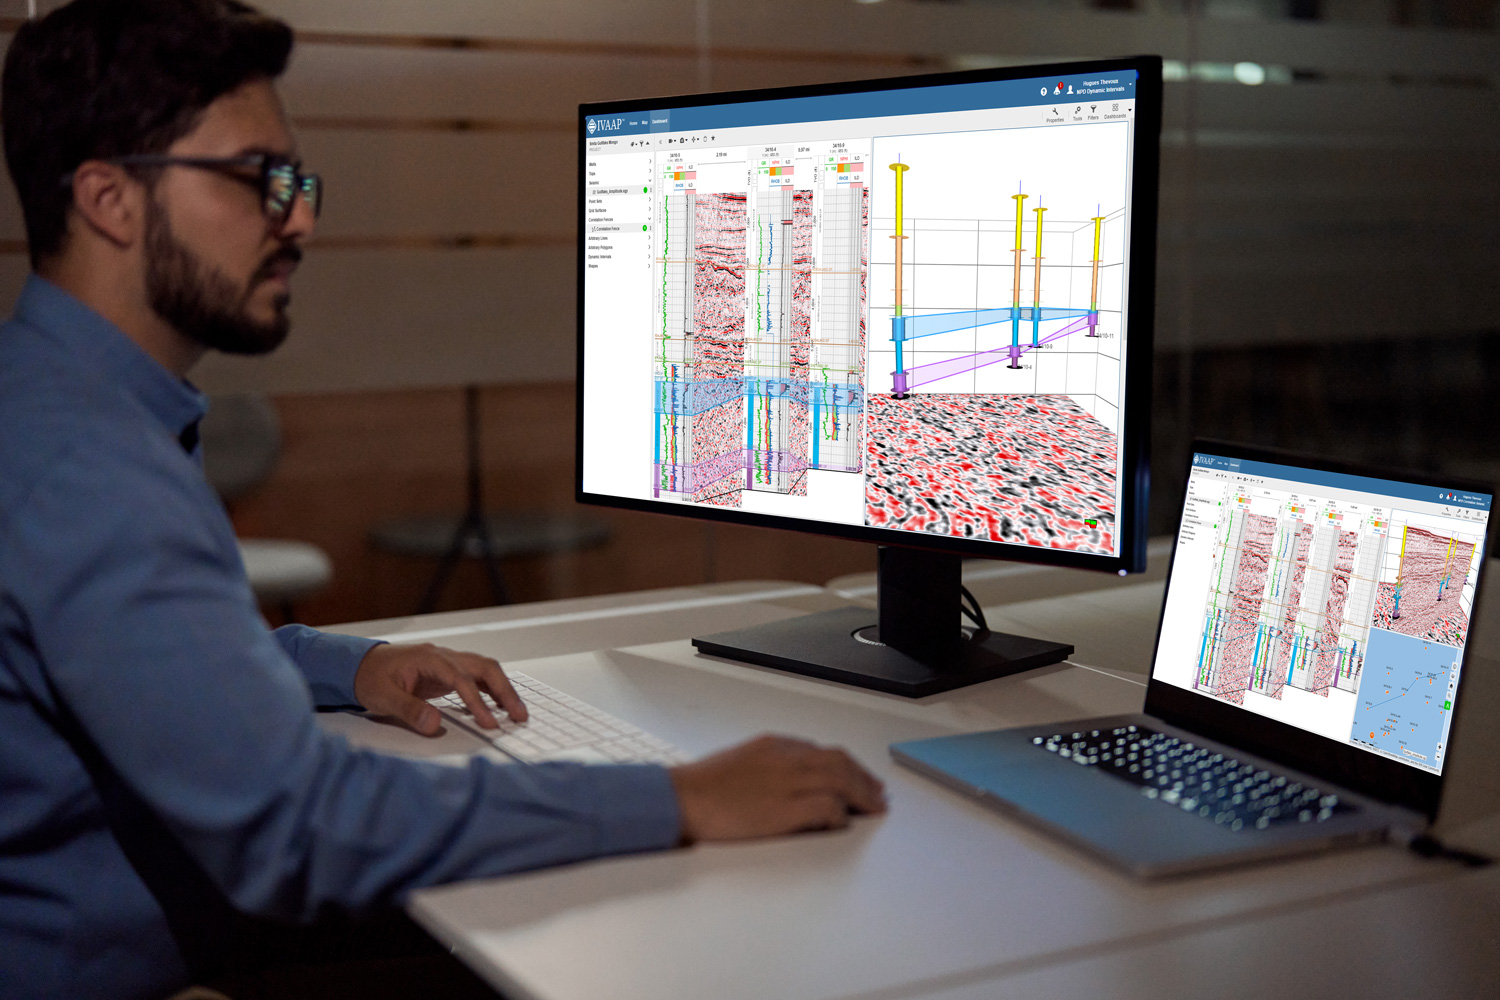
New subsurface visualization tools, enhanced OSDU support, expanded Python integrations, an updated SDK, and faster rendering accelerate decision-making and maximize productivity in the Energy industry.
Houston, TX — August 26, 2024 —INT, a global leader in software and services for the energy industry, today announced the release of IVAAP 2024, a significant upgrade to its flagship data visualization and analysis platform. IVAAP 2024 introduces powerful new features and enhancements designed to streamline workflows, accelerate insights, and empower users to make better-informed decisions.
“IVAAP 2024 represents a substantial leap forward in how geoscientists can interact with and analyze their data,” said Hugues Thevoux, VP of Cloud Solutions at INT. “We are focused on delivering tools that provide greater flexibility, efficiency, and deeper insights, ultimately driving greater productivity and better outcomes for our customers.”
Top Highlights of IVAAP 2024:
New Visualization Tools
- Powerful Seismic Correlation: The Correlation Widget now allows visualization of seismic volume data between wells, enabling geoscientists to identify and analyze geological features with greater accuracy.
- Dynamic 3D Visualization: The enhanced 3D Widget now supports dynamic intervals and lithology curves displayed along the correlation fence or well trajectories, providing a clearer understanding of subsurface relationships in a visually engaging way.
- Enhanced Widgets: Improved performance, functionality, and customization options across various widgets, including Linechart, Cross-plot, Basemap, Box Plot, and WellLog.
Optimized Data Organization
- Intuitive Data Discovery: The new Data Tree Widget allows users to visualize and reorganize data by labels, offering a more intuitive and efficient way to navigate complex datasets.
- Technical Assurance: Instantly identify data quality levels — certified, trusted, suitable, or unevaluated — for confident technical assurance.
- Faster Data Rendering: Experience lightning-fast data rendering, even with massive datasets.
External Services
- Advanced Python Tools: Perform isochore calculations and leverage the power of convolutional neural networks (CNNs) for top prediction, enabling more sophisticated analysis and interpretation of your subsurface data.
- Expanded OSDU Support: Support for OSDU data types now includes horizon data and OSDU Wellbore DDMS log data. Seamlessly create, update, and delete these critical data types directly within IVAAP, streamlining your data management and analysis workflows.
Extensibility
- Improved SDK: The IVAAP SDK has been migrated to TypeScript and GeoToolkit.JS 2024 for improved code quality and maintainability, along with a new Schematics widget, updated tutorials, and improved API for easier integration and development.
For further information on the full list of features and enhancements in IVAAP 2024, please visit www.int.com/ivaap.
Read the IVAAP 2024 Release Notes.
____________
ABOUT IVAAP:
IVAAP™ is a Universal Cloud Data Visualization Platform where users can explore domain data, visualize 2D/3D G&G data (wells, seismic, horizons, surface), and perform data automation by integrating with external processing workflows and ML.
ABOUT INT:
INT software empowers the world’s largest energy and services companies to visualize their complex subsurface data (seismic, well log, reservoir, and schematics in 2D/3D). INT offers a visualization platform (IVAAP) and libraries (GeoToolkit) that developers can use with their data ecosystem to deliver subsurface solutions (Exploration, Drilling, Production). INT’s powerful HTML5/JavaScript technology can be used for data aggregation, API services, and high-performance visualization of G&G and petrophysical data in a browser. INT simplifies complex subsurface data visualization.
INT, the INT logo, and IVAAP are trademarks of Interactive Network Technologies, Inc., in the United States and/or other countries.

