GeoToolkit.JS provides a set of libraries that display seismic, log, schematic, contour, real-time data, and more, and it includes a lightweight widget to display geographical data as layers from web map tile services (WMTS) like Google Map, OpenStreetMap, ESRI, MapQuest, and others and vector data from web map feature services (WFS).
WFS services can provide data in popular formats such as GeoJSON and ArcGIS ESRI Feature Layer format, KML. In this post, we consider how to display data, which includes geometry and nonspatial information like names, from ArcGIS ESRI services using the GeoToolkit.JS Map Widget and WMTS data from OpenStreetMap. The release of GeoToolkit.JS 2.5 is a good opportunity to tour basic map options.
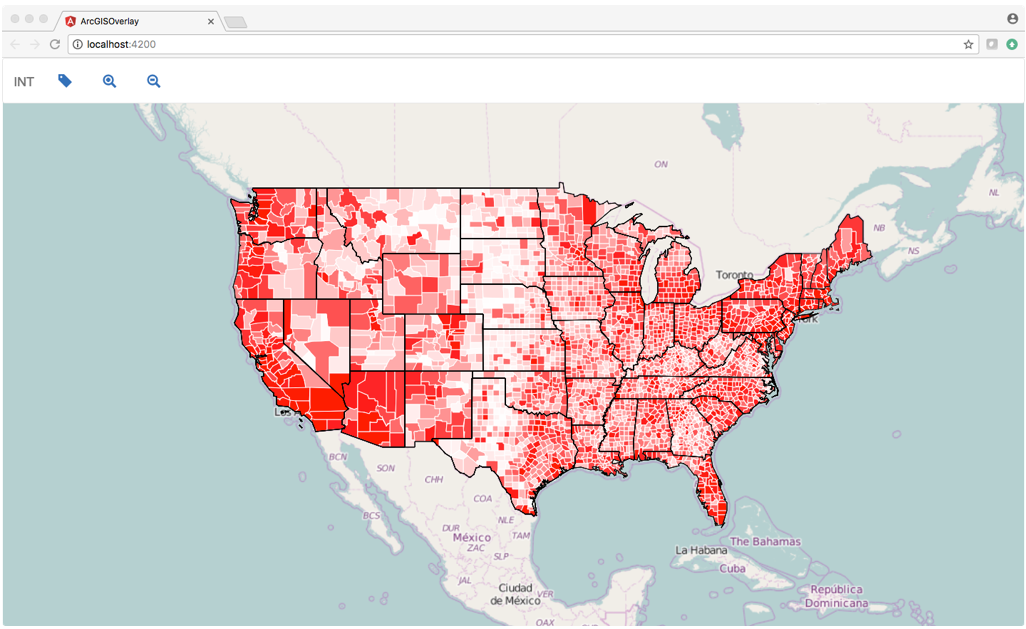
First, we need to have the latest version of the GeoToolkit.JS library in our system. We will use Angular framework and TypeScript to be more realistic to real-world web application. Also Angular CLI is used to simplify creation of this application. The following screenshot demonstrates a simple map application with three layers: WMTS with world map, ArcGIS Feature layer of states, and ArcGIS Feature layer of U.S. counties from public service.
The full source code of this example can be found here on Github.
Let’s start writing application. If general initialization of Angular application is not relevant to you, then start with section 3.
Install the Necessary Software
This step can be skipped if you have Angular-cli and node.js on your computer.
Verify that you have node.js and npm in your system using the following command in console:
node -v
If installation does not exist, then go here and install the last LTS distribution.
The next step is to install the last version of Angular-cli in your system.
npm install -g @angular/cli
Create the Application
We start creation of the application using Angular-cli commands ng new
ng new ArgGISOverlay
cd ArgGISOverlay
ng serve
If it works, then create a folder called ArcGISOverlay\src\libs\geotoolkit and copy all files from the bin folder of GeoToolkit.JS installation.
Add a section in the .angular-cli.json file
“scripts”: [
“libs/geotoolkit/geotoolkit.adv.js”,
“libs/geotoolkit/geotoolkit.controls.adv.js”,
“libs/geotoolkit/geotoolkit.svg.adv.js”,
“libs/geotoolkit/geotoolkit.data.adv.js”,
“libs/geotoolkit/geotoolkit.pdf.adv.js”,
“libs/geotoolkit/geotoolkit.widgets.adv.js”,
“libs/geotoolkit/geotoolkit.map.adv.js”
],
Add a new component to display the map. Let’s call it OverlayComponent
ng g component overlay
Add CSS file to define application styles and add to styles.css
Add the following lines to app.component.html
<div class="content">
<app-overlay></app-overlay>
</div>
Add the following lines to overlay-component.html to specify HTML% canvas element to be used to render map. Parent div is used to control size of our map.
<div #parent class='plothost'>
 <canvas #map class='plot' oncontextmenu='return false'></canvas>
</div>
Add Layers
A map widget can support any number of layers. In our example, we add three layers.
The first is the WMTS layer which points to INT OpenStreetMap server.
return new geotoolkit.map.layers.WMTSLayer({
   'server': ['https://demo.int.com/osm_tiles/'],
   'minlod': 0,
   'maxlod': 19,
   'formatterfunction': function (z, x, y) {
     return z + '/' + y + '/' + x + '.png';
   }
 });
Second, add two ArcGIS overlays with data from the public URL of ArcGIS Feature Layer services. A layer initialization to load states looks like:
return new geotoolkit.map.layers.ArcGISFeatureLayer({
    'system': geotoolkit.map.GeodeticSystem.LatLon,
    'idfield': 'state_name',
    'server': service_url
     });
};
It has three properties: the input coordinate system, unique field id, and server url. The second layer is similar.
If a source has a field, which defines a unique id of the feature, then it can be specified. This information can be found on page with service description. In our case, one layer has id, another doesn’t have it. If id is not specified, then artificial id is assigned for each feature.
In additional to geometry, each feature layer can provide nonspatial attributes. By default, layer loads all attributes for each feature. If you don’t need it, then you can declare them using property requestfields like this requestfields: [‘name’, ‘population]
In the next step, create a map widget and add three layers into it.
let map = new geotoolkit.map.Map({});
map.addLayer(this.createWMTSLayer());
map.addLayer(this.createCountiesLayer());
map.addLayer(this.createStatesLayer());
The last step is to initialize GeoToolkit.JS plot to render map layers on underlying HTML5 Canvas element, and the application is ready.
Customize the Feature Layer
In this section, we show how to change the graphical properties of the loaded Feature Layer. For example, we would like to color counties based on population. We just use one attribute of the counties layer “pop2000”, which represents a population of each county in 2000. A feature in ArcGISFeatureLayer can be rendered with shape template, which can be polygon, polyline, symbol, or any custom representation. For example, pie chart.
As a rule, it has only one instance of template for the sample type of features. In our case, we sort existing features by population and replace shape template, which is responsible for rendering particular features with custom shape with specified attributes. The result of this operation can be seen if you press the “Classify” button on the toolbar of this application. The source code looks like this:
this.countiesLayer.setTemplate(country, template);
We tell the application to use a new template for this feature instance. This application can be optimized if we group features by colors, but we will save that for a future post.
For more information about GeoToolkit, visit the GeoToolkit product page, or contact us for a free trial.


