The Forces Driving Transformation
Traditionally, the oil and gas sector has been slower than other industries to adopt new software and technology. When the market is doing well, companies have little time or motivation to invest in change. When the market is bad, companies lack the appropriate resources and budget.
Since 2015, the oil and gas sector has experienced significant changes. An aging workforce, low oil market price, and the pressure to transition to cleaner energy are among the many factors forcing the Exploration and Production industry to rethink how it works, recruits, trains, and operates in order to stay in business.
As a result of the many factors at play in today’s market, the pressure to increase or restore profitability and expand operations is unavoidable. Many companies are choosing to proactively adopt and integrate new technology to help them respond to this pressure to evolve.
Digital Platform Building Blocks
The term “digital transformation” is widely used to describe the integration of technology into all areas of a business, effectively digitizing operations to provide better access to data and decision-leveraging systems in the cloud.
As part of the digital transformation process, data science and machine learning can be smart ways for companies to focus more on analysis and to automate operations that can be expensive and tedious to perform manually.
Whether built internally or purchased from a software provider, many of the digital platforms used in the industry integrate each company’s proprietary science and workflows. While each platform may be unique, they do share a set of common functionalities, such as:
- Cloud Data Lake
- Data Mining
- Machine Learning
- Cluster Analysis
- Databases
- Streaming of Data Sources
- Cloud Storage
- Visualization
Unfortunately, the focus of selecting and/or developing a digital platform is often on the data science aspect, leaving user interaction and visualization as an afterthought, often overlooked until late in the development lifecycle.
Cross-Domain Visualizations
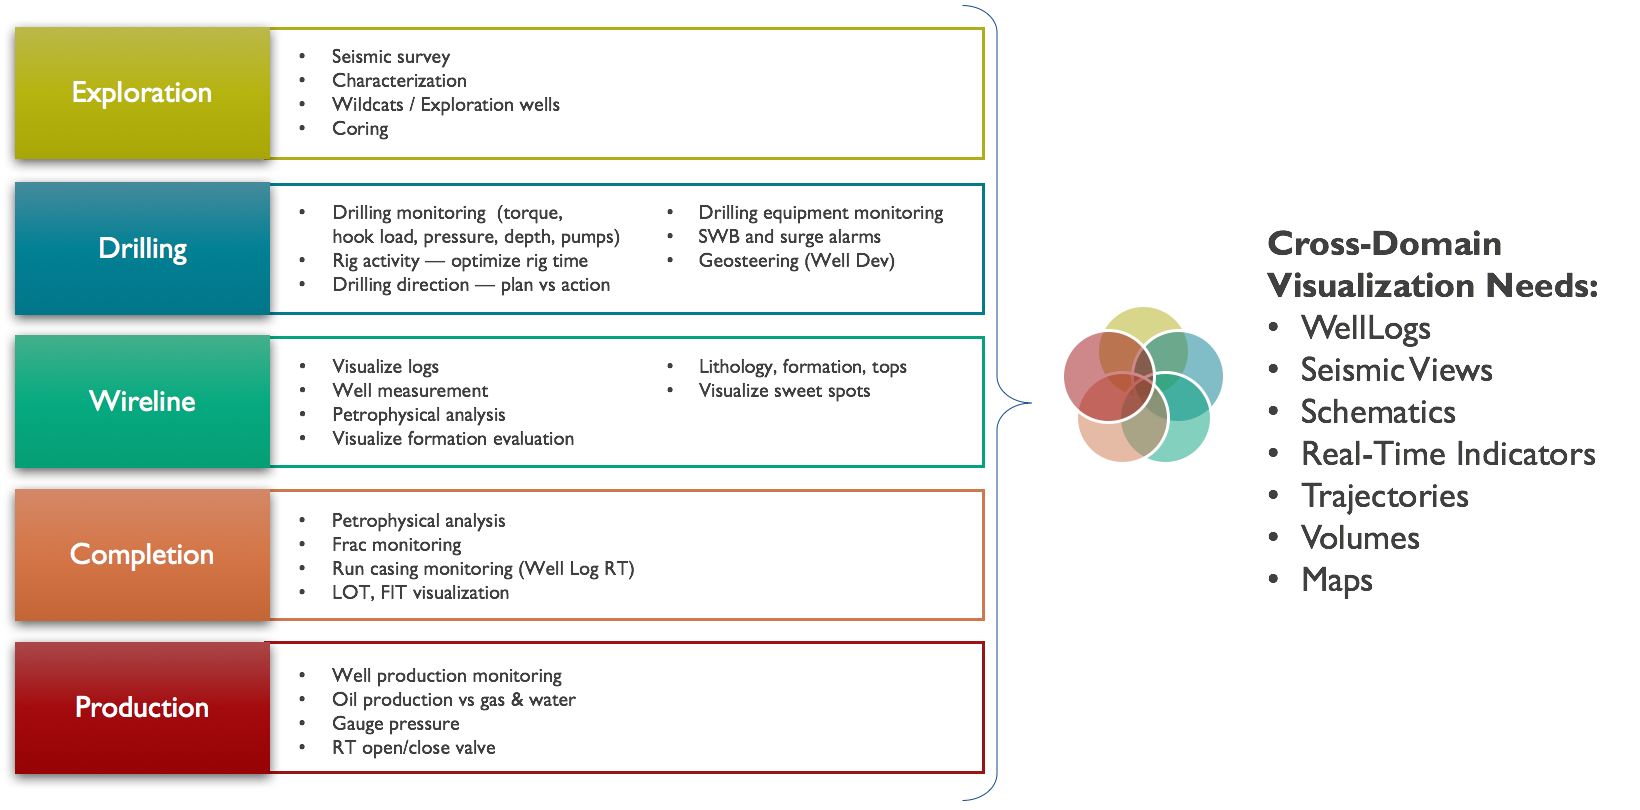
Looking at some of the key functions and workflows in E&P from a high level, it is clear that many of the use cases and workflows share common data views and data sources and would benefit from a platform that integrates them all.
Majors and IOCs should consider these shared use cases when designing or choosing the user experience of their digital platform as they require a visualization platform technology that is modular enough to tailor the user experience and workflows specific to each stage of the lifecycle (see Fig.1).

How to Evaluate an Enterprise Cloud Viewer
A product owner, architect, or chief engineer/developer who wants to build or implement a digital solution must assemble and assess various pieces of the puzzle: machine learning engine, database, cloud infrastructure, data search, search, workflows, etc.
In order to avoid reinventing the wheel, many companies choose a cloud-friendly enterprise viewer platform that can be used out of the box. However, there are many factors to consider when evaluating an enterprise cloud viewer.
The Number One Cause of Cloud Solution Failure: Lack of User Adoption
To avoid adoption failure, an Enterprise Cloud Viewer must offer a consistent and unified user experience across workflows through a single interface that can be adapted as needed, depending on the workflow and the user profile. Ideally, a solution built using a user-centered design approach will provide contextual experience for both remote and on-site experience.
Cloud Viewer Technology Adoption: Other Considerations
This list of points to consider when adopting a new cloud viewer platform is not intended to be exhaustive, but it is a great start for an evaluation or as a requirement list for an RFP for an E&P Cloud Visualization Framework:

1. Advanced Data Visualization
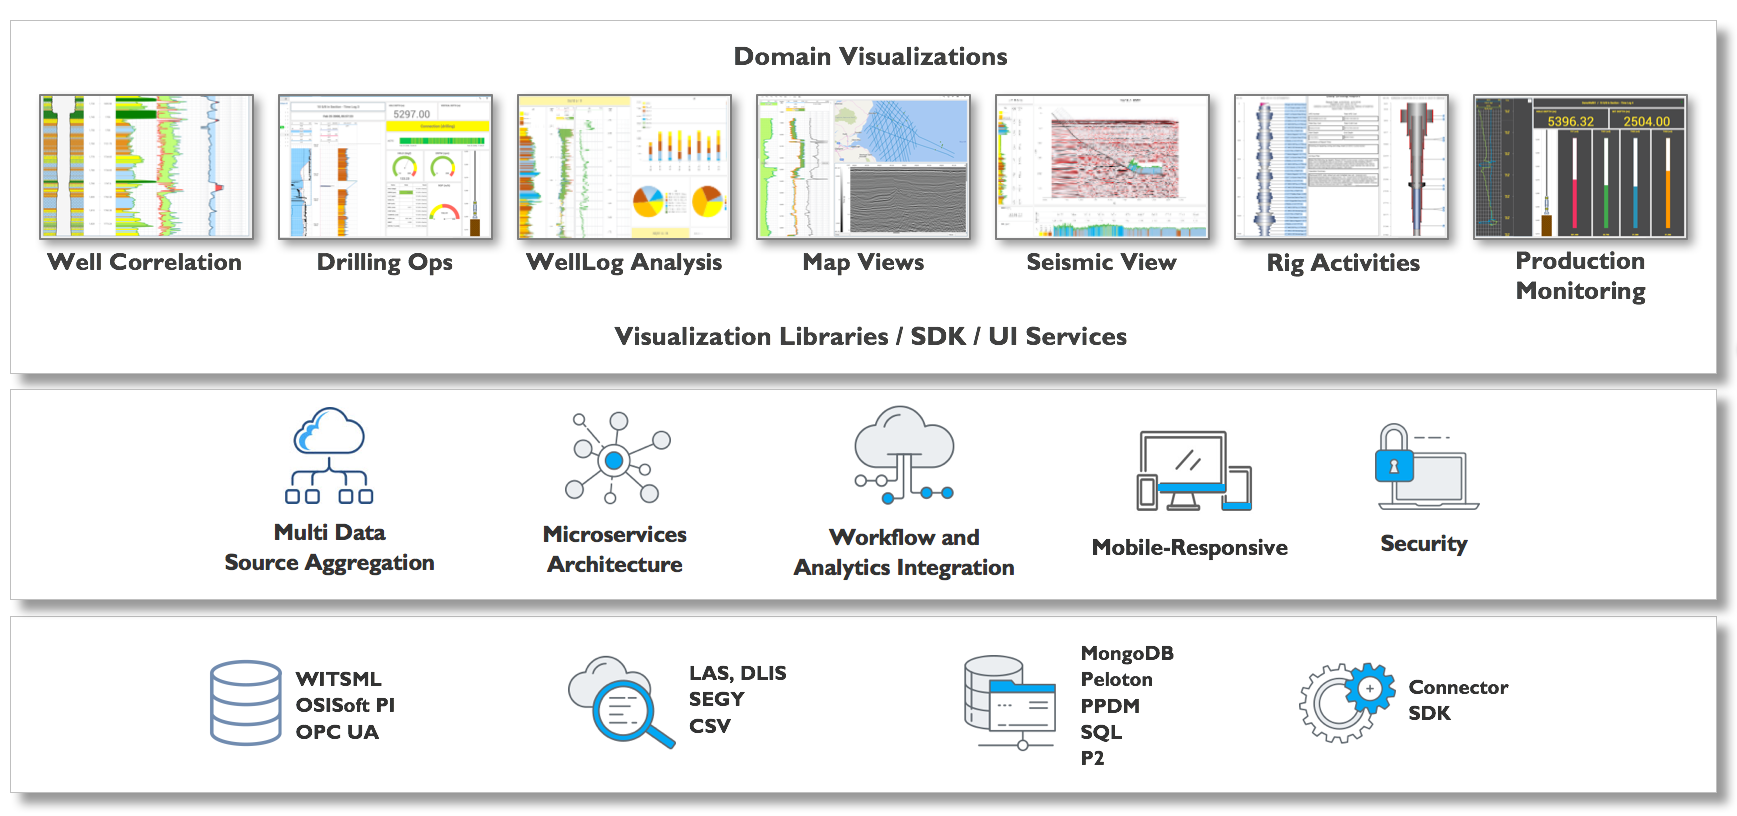
The visualization framework should offer specific domain views: WellLog, Schematics, BHA (animated or not), Seismic, and 4D/3D/2D in web-based local and/or remote visualization service. It should also have the ability to display very large datasets with high performance, seamlessly leveraging compression/decompression and decimation algorithms.
- G&G/Seismic — Support standard file formats in E&P, such as SEG-D, SEG-Y, DLIS, and LAS in 2D/3D and custom formats used in specific workflows.
- Visualize Faults: Simple geometry, complex geometry, fault surface interpolation
- Visualize GeoModel: 3D layer representation with horizon, faults
- 3D volumetric rendering
- Drilling / Drilling Monitoring — Display well log and deviated well log data to perform geosteering (GST). Display surface sensor data (torque, hook load, pressure, depth, pump strokes), set custom alarms—swab & surge, vibration, ROP, WOB, RPM
- Display well data with seismic (overlay)
- Well log visualization (plot multiple curves, view markers, line displayed, colored display)
- Offset wells display for correlation with the active well.
- Display of drilling analytics to optimize rig activity (OPEX)
- Directional drilling — plan vs. actual (3D trajectory in RT, BHA Schematics )
- Composite log
- NPT visualization
- Geomechanics (rose diagram)
- WellLog – providing display of curves and sensor data.
- Multi-well view supported in the same browser session
- Logging (wireline & while drilling) — Visualize petrophysical data
- Completion — Display logs. visualize fracking data, run casing monitoring, view well schematics (plan vs. actual)
- Time and depth (MD/TVD) based data, ability to switch indexes, image log support, passes/run, etc., from surface to sensor depth
- Production — Monitor multiple individual well performance and well parameters, provide alarm messages for abnormal conditions, real-time reading, trending capabilities, KPIs reporting capabilities
2. Intuitive Visual Exploration
To ensure user adoption, the user interface must be intuitive. It should enable the exploration of data via the manipulation of chart images, with the color, brightness, size, shape, and motion of visual objects representing aspects of the dataset being analyzed. The tool should enable users to analyze the data by interacting directly with a visual representation of it.
- Versatile User Interface/User Experience (UI/UX) with user-configurable preferences and collaborative functions. An intuitive UI/UX requiring minimal training of internal/external customers.
- HTML5/JavaScript to support mobile-responsive needs, including non-graphical data that can be displayed on smaller devices.
- Support touch screen (for mobile, tablet, touch screen monitors, etc.)
- Map views for navigation and selection of data
3. Embedded Analytics
Users should be able to easily access advanced analytics capabilities contained within the platform or through the import and integration of externally developed models.
4. Interactive Dashboards
The tool should allow users to create highly interactive dashboards and content with visual exploration and be able to conduct search-based discovery.
- Reusable Visualization and Dashboard Templates
- Content Authoring
- Animation and Playback
- Formatting and Layout
5. Publish, Share, and Collaborate Capabilities
Users need to be able to publish, deploy, and operationalize visualizations. To collaborate more efficiently, users need the ability to share, discuss, and track information, analysis, analytic content, and decisions (embedded dashboard link, PDF printing, chat, and annotations).
6. Scalable Architecture
Modular architecture using microservices should integrate seamlessly with customer or third-party data science or workflow.
- Resilient and fault-tolerant
- Wherever possible, the system should be constructed from distributed redundant components transparent to end users.
- Readily supports all global and standalone deployment scenarios (in-country / in-customer / in-cloud deployments)
- Modularization of the system that should be composed of multiple services with transparent or industry-standard interfaces or services such as WITSML.
- Developers should be able to develop their own components that simply plug into the existing viewer infrastructure. The messaging system should be open.
- There should be an API to subscribe and publish to messages inside the service infrastructure.
- SDK (client, framework)
- The SDK should be able to provide developers with the ability to simply develop and build new display widgets or extend existing ones.
7. Platform Capabilities
The capabilities are offered in a single, seamless product or across multiple products.
- Playback for all records of the well (variable speed, pause, and rewind)
- Multiple language and character sets support
- Data versioning for analysis and retrieval
- Data storage/history
- Global mnemonics, unit types, unit set, unit conversion
- Acquisition real-time status indication
- Client connection status indication
- Coordinate reference transformation capability
- Alerts and alarms (critical/notifications) with rapid (near real-time) delivery via email/SMS or out-of-band support
- Data latency — the data should be delivered in near-real-time from the source of where the data is acquired by the system to the end-user display.
- Programming Interfaces / API Integration (WITSML, PRODML, and WITS Applications)
- Unit-of-Measure Conversion
- Data Source Connectivity – Aggregation of structured and unstructured data contained within various types of storage platforms, both on-premises and in the cloud:
- WITSML, ProdML, ResqML, WITS, PPDM, OPC UA, OSIsoft PI, SQL DB, NoSQL DB…
- Data Export in CSV, LAS, ASCII
- Analytics (KPI) reporting via custom dashboards or built-in widgets
- Math engine / expression-based math solver — input formula and calculation — for instance, calculate pore pressure, MSE (Mechanical Specific Energy)
- Data writes back to database
- Annotations
- Ability to switch/toggle between screens
8. Infrastructure, Administration, Security
Capabilities that enable platform security, administering users, auditing platform access and utilization, optimizing performance and ensuring high availability and disaster recovery.
- The service incorporates a comprehensive entitlements system allowing user access to be managed down to the individual curve level
- User access, usage and operating metrics are monitored and recorded for support, security, performance, and activity auditing and reporting
- Role-based security be based on user groups and roles
- Single Sign-on (Authentication and Authorization)
- User administration
- Full audit functionality, usage monitoring
- Vulnerability
- Encryption
- High availability and disaster recovery
- Scalability and performance
While these may not be all of the features to consider, these should provide a solid foundation for any company that wants to evaluate an enterprise cloud viewer for the E&P industry.
For more information about our enterprise data visualization solutions, visit the IVAAP product page, or contact us.

