The Carnac3D module is part of the GeoToolkit.JS library and utilizes WebGL 2.0 technology for 3D rendering on web browsers. For those who are not familiar with it, WebGL doesn’t require an extra plug-in and is built-in for almost all browsers, such as Chrome, Firefox, Edge, and Safari.
GeoToolkit’s 3D library is extremely useful for developing professional applications. It provides rich oil & gas-oriented components, including seismic, grid surface, well trajectory, well log, heightmap, reservoir, schematics, volume rendering, and a bunch of visualization tools like picking, highlighting, and cursor visuals.
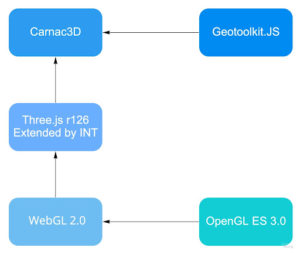
From the relational graph, you can see Carnac3D is integrated with the GeoToolkit base module, and also uses Three.js. Three.js is an open-source library that provides many low-level functionalities like renderer and scene graph. It provides many useful data types that can be used directly in our users’ applications. In GeoToolkit 3.3, we upgraded our internal Three.js to version 126, to maintain compatibility. For users that care about the core implementation of 3D, and maybe want to extend GeoToolkit on their own, WebGL 2.0 is a subset of OpenGL ES 3.0, and the shader version is GLSL 3.0.
In 3.3, we added seismic intersection with other 3D objects and a new grid surface loader called EarthVision loader. We also added a new widget called the projection widget. For minor features, an option was added to display flat shading surfaces, and also an auto-rotating mode to the 3D plot.
For rendering, we improved the accuracy of transparency rendering, reservoir grid performance, gridline, and isoline rendering, and anti-aliasing.
New Feature: Seismic Intersection with Grid Surface
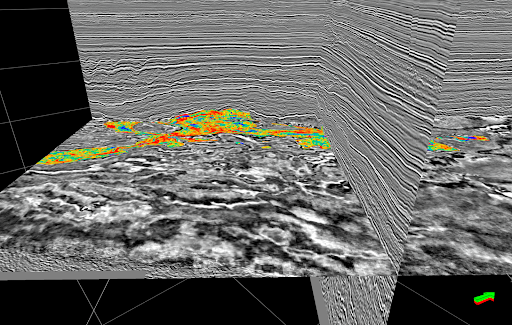
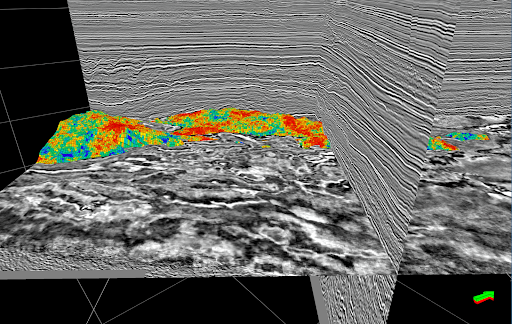
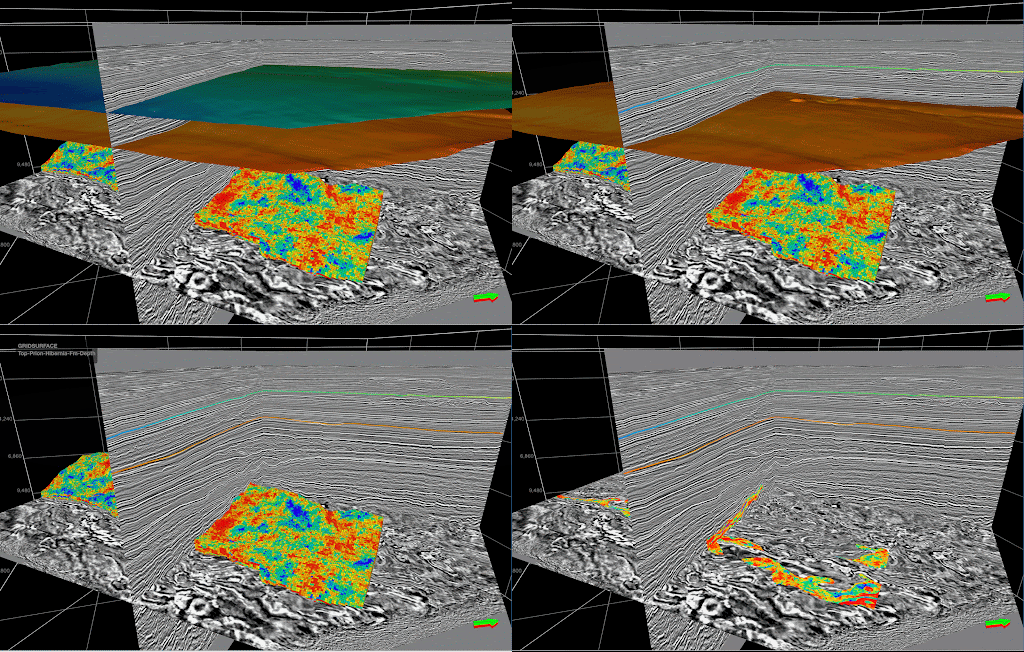
We know that we can add multiple objects to a seismic volume such as grid surface, horizon, and reservoir. They are all intersected with each other. This causes an issue that makes it hard to observe the details with so many objects on the screen. Users must adjust the camera constantly to find the best angle. To resolve this issue, we introduced IntersectionHelper.
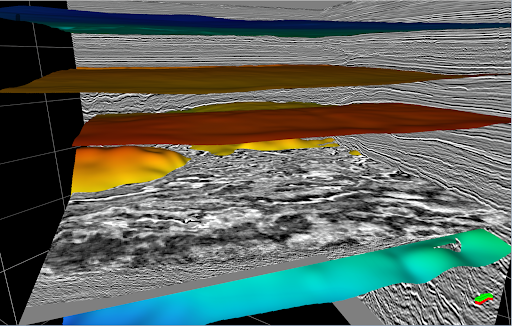
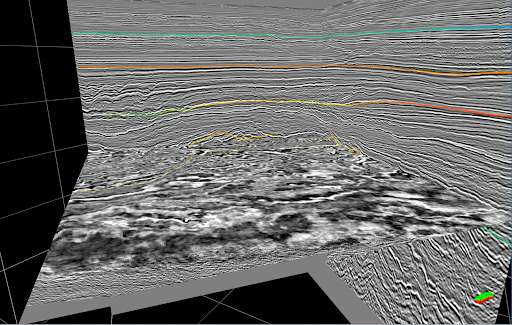
The intersection helps us preserve the detail of seismic and objects. We can clearly see its position in inline, xline, and time slice.
IntersectionHelper also supports reservoir intersection. When we visualize a reservoir with seismic, some cells are hidden inside the reservoir. With intersection, we can better observe the properties at intersected planes.
New Feature: EarthVision Surface Loader and Un-Triangulated Data
EarthVision is a commonly used format in oil and gas applications for loading grid surfaces. It converts the field data to a format that can be recognized by a 3D renderer.
The format specification is, for each line, it has the following:
Column index and row index are optional. If they are not provided, the data loader will mark it as un-triangulated data. So in the next step, the SurfaceData class will triangulate vertices using a gridding algorithm. If indices are provided, the SurfaceData has more information, so it can perform a much faster triangulation.
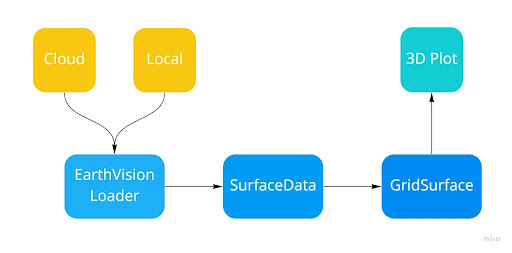
EarthVision loader can load data from either cloud server or local files, as long as it has a proper URL. Then it sends the result to SurfaceData, which is a predefined data class for preparing the data that the GPU can read. We include that and send it to the GridSurface instance. By adding surface instances to the 3D plot, we can finally visualize it.
The specification is:
xPos, yPos, zPos [, colIndex],[rowIndex]
The data loader automatically identifies the type of data and triangulates for users if necessary.
New Feature: Projection Widget
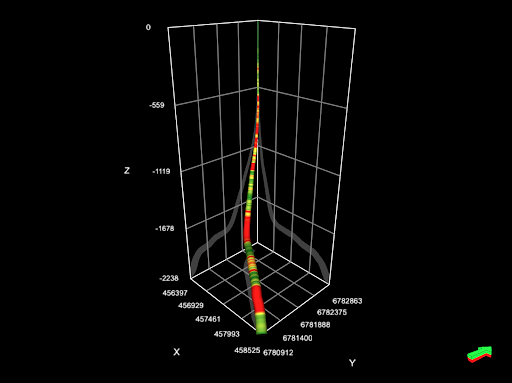
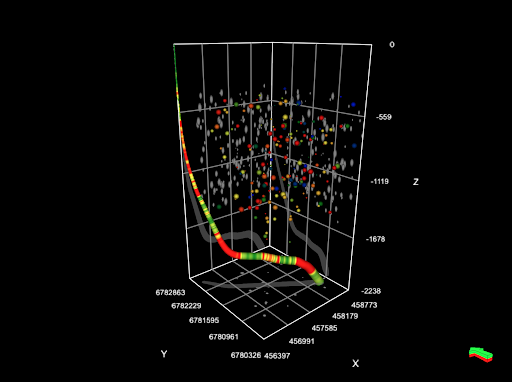
GeoToolkit’s new projection widget can project objects onto its grid planes so that users can better visualize an object’s position in the x/y/z axis. And most importantly, it supports almost all objects in 3D. This widget includes a built-in grid, and it can add projections using only one line of code.
New Feature: Flat Shading Surface
A new minor feature that has been added to 3.3 is the flat shading surface.
The first example below shows a surface with smooth shading. While most of the area is super smooth, when it comes to faults or cliffs, it isn’t that good. This is because two adjacent polygons have a huge gap in terms of the surface normal, meaning the transition is not smooth anymore.

To solve this uncomfortable artifact, we use flat shading. For flat shading, the lighting is evaluated only once for each polygon, and each polygon only has one color. You can see this in the second screenshot, where faults and cliffs are preserved very well. Here, the lighting is evaluated only once for each triangle so each triangle only has one light level.

Improvement: Accurate Order-Independent Transparency Rendering
One of the most distinct improvements is the switch to accurate transparency rendering. To produce accurate transparency in rasterization is a challenging task, so the usual “go-to “ solution is to render transparent objects from back to front.
But this solution is not perfect, and in many cases, it can result in artifacts. The most obvious case is when we have two or more intersecting objects — none of them is really in front or behind the other, much like in the first picture.
To solve this, GeoToolkit.js now uses Depth-peeling rendering. It provides what is called “Exact Order Independent Transparency,” meaning transparent objects are rendered correctly, without even needing to sort them. The result can be seen in the second picture.
The principle is quite simple to understand: To render each transparent object layer on top of each other, we have to render them one by one, separately and combine the results in the right order.


The final result of a single depth-peeled frame requires multiple rendering passes.
Each pass carefully keeps its color result, but also its depth buffer result, which is a map of the depth of each pixel of the 3D scene.
Now, with that in mind, here’s the process:
First, we render all the opaque objects, since they are opaque, everything behind them is not visible, so we only need to draw them once. This is a big time saver. Then, we render every transparent object, but only keep one fragment per pixel, which is a single object color per pixel. This means if in the same pixel, two or more transparent objects overlap, we only keep the front-most one. Once done, we keep the image result for later, and also update the depth buffer based on the fragment we kept. Then we repeat the last step, we draw every transparent object again, but this time we keep the pixel color only if they are deeper than the previous pass pixel. This depth test ensures that we render a different layer each time. We repeat this step as much as we need since each pass provides one additional transparency layer. And finally, all passes are composed, from back to front, in a final image.
In our case, depth peeling uses five transparent passes by default. It is of course customizable, but this configuration provides a good compromise between transparency depth and performance.

Improvement: Improved Reservoir Grid Performance
In 3.3 we improved the performance so that reservoirs now render between 2x times and 4x times faster than before. Reservoirs are infamous for being slow to render, mainly because of their potentially large number of cells.
Starting with a couple of thousands of cells, most current GPUs hit what we call a vertex bottleneck, meaning there is simply way too much geometry to render, even when using advanced techniques like instanced rendering.
So the only solution to improve performance here is to draw fewer cells. In 3.3, we improve the performance by optimizing the reservoir geometry and the updates to the GPU memory.
First, we do not draw filtered cells that have been hidden by the user through value or position filters. Then, we do not draw cells that are hidden by their surrounding cells; we call them occluded cells.
So on an average reservoir, only 30 to 40% of the cells are actually visible. This means we have to render 60 to 70% less geometry, thus removing a huge load on the main bottleneck in the rendering pipeline.
Of course, this improvement sounds simple enough, but in practice, there are important points that need to be carefully addressed. First, we must accurately identify the occluded cells, making sure they are hidden by all six of their neighbors. And we need to be able to update the geometry whenever a filter is updated, fast enough so that the user does not notice it.
Improvement: Lines Rendering
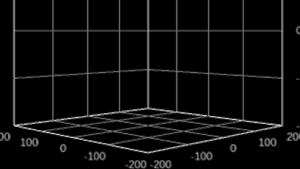
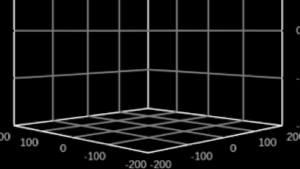
Before, lines were showing a lot of step artifacts, and it was difficult to have consistent and good looking lines. The issue is related to aliasing, but the principle is that it is hard to properly draw a line, which is a vector, onto a screen, which is a raster device. It is hard to draw oblique lines with square pixels, as you can see in the picture on the left. To solve this, we have implemented a powerful anti-aliasing technique into the line rendering.
As you can see in the pictures below, the step-looking artifacts are entirely gone in the new version on the right, and the linewidth is much more consistent across all view angles. So this improvement will be mainly visible on the plot grids.
Improvement: Anti-Aliasing Optimizations
Finally, we have the optimizations to the full scene Anti-Aliasing. GeoToolkit 3.3 introduces new anti-aliasing techniques and strategies, to improve image quality with a limited impact on performance.
Aliasing artifacts are those steps you can see in the left-most picture — instead of a straight line, we see jagged edges. This is because we are trying to represent a line with pixels, which are effectively squares, thus an oblique line will produce steps if nothing is done.
A more mathematical approach to the issue is that we are sampling and displaying a line, which is a function, with a raster monitor, which has pixels. A function can produce an infinite number of positions, but a pixel based monitor can only display a set number of pixels.
And the step issue gets worse as you reduce this number of samples and pixels. Different anti-aliasing techniques provide different results at different costs.
The simplest ones try to detect and blur the edges of polygons, in a post-processing treatment, while the more advanced ones generally increase the sampling rate, by taking multiple samples per screen pixel, resulting in increased quality, but lower performance.
In 3.3, we introduce two new anti-aliasing techniques that try to cover both ends of the spectrum.
For low-pixel-density monitors, high-quality anti-aliasing is used, called Super-Resolution Anti-Aliasing. This AA increases the number of samples per pixel, so each pixel is the product of several samples, increasing the image quality while also greatly reducing aliasing. This compensates for low-resolution monitors that naturally produce more visible artifacts because of their reduced pixel density.
For high-pixel-density monitors, however, more performance-friendly anti-aliasing will be used, called FX Anti Aliasing (FXAA). This AA reduces artifacts by detecting edges in the image and thus is much more performance-friendly. This compensates for large resolution monitors, which already have good image quality, but are also much more demanding in terms of performance.
Overall, this approach allows reduced aliasing in the scene, while keeping consistent performance and quality across different monitors. Or to put it more simply, higher quality for small monitors, and better performance for large monitors.
To learn more about GeoToolkit.JS, please visit int.com/products/geotoolkit/or contact us at support@int.com.
