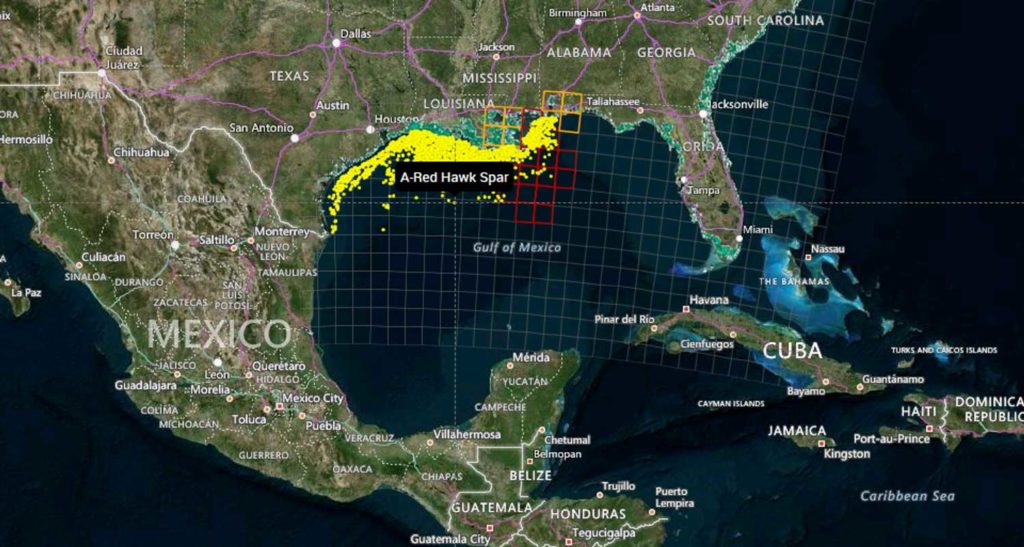
Map-based search is an integral part of subsurface data visualization. In order to meet usability expectations, developers of subsurface applications in the cloud must add powerful map and map-based search functionalities.
The GeoToolkit map widget simplifies the process, allowing users to get quick and clear insights using common web mapping services. In this blog post, we will cover how to access the map widget in GeoToolkit, how to integrate other Web Services, including ArcGIS, ESRI REST, OpenStreetMap, Google, Microsoft, etc., and more about GeoToolkit’s features, including layering, labeling, symbols, annotations, and more.
Features
With GeoToolkit.JS, there are many general functionalities that you can use in your web application. The map, which is based on the Core toolkit, provides two different versions of libraries: it has ECMAScript 6 or if you’re going for a more classical approach, ECMAScript 5. It can be used in part with different UI frameworks like React, Angular, or VUE. Moreover, it has user-friendly functionalities like symbol aggregation, label collision, export to PDF, and imaging formats.
There are also different functionalities that can be available such as axes, titles, and scrollbars. The predefined interaction tools allow you to display crosshair, panning tools, zoom to measure distance, tooltip, rubberband, and more. GeoToolkit.JS map supports a wide range of map formats and services like ArcGIS, GeoJSON, KML, Mapbox, Bing, and so on. It is also compatible with other GeoToolkitJS elements like charts, shapes, and widgets.
Getting Started
import {Map} from '@int/geotoolkit/map/Map';
import {Plot} from '@int/geotoolkit/plot/Plot';
import {Tile} from '@int/geotoolkit/map/layers/Tile';
const map = new Map();
map.addLayer(new Tile({
 'name': 'OpenStreetMap',
 'url': https://demo.int.com/osm_tiles/{z}/{x}/{y}.png
}))
const plot = new Plot({
  'canvaselement': canvas,
  'root': map
});
- Create a map widget.
- Connect DOM canvas with the widget by creating a Plot done like other widgets.
- Add a layer (or layers) of interest to the widget.
Web Services: ESRI REST, OpenStreetMap, Google, Microsoft
It is important to consider which types of services can be supported since all of your data is received from different types of servers. Some services hosted include: ESRI Rest, ArcGIS, OpenStreetMap, Google Map, Microsoft, etc.
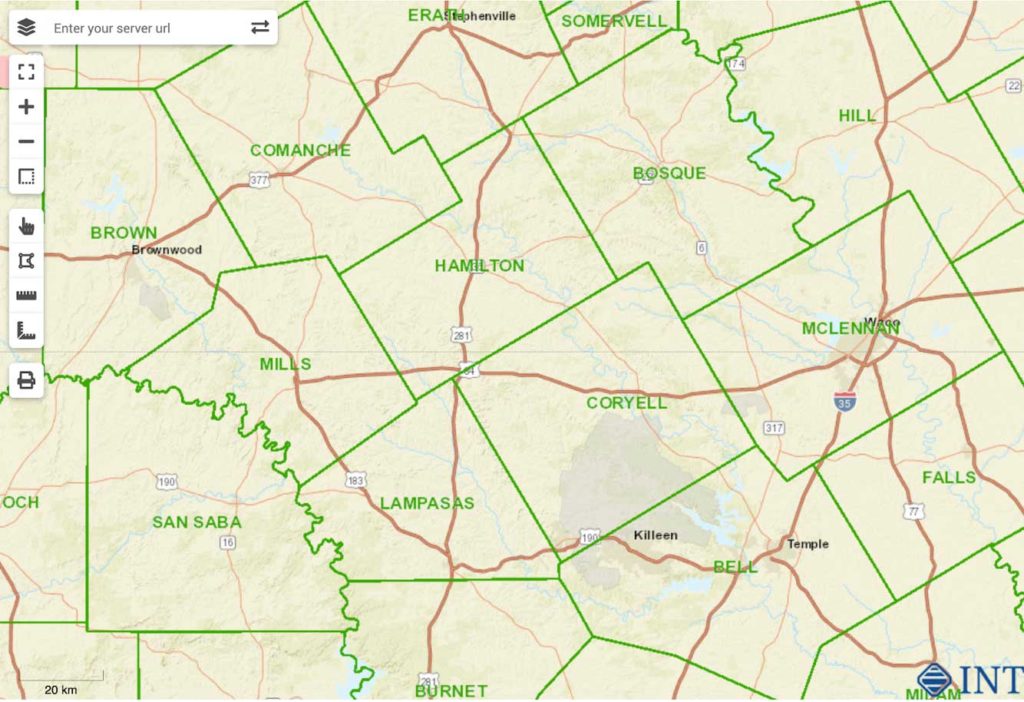
The ArcGIS Web Map protocol which is used by ArcGIS online is an easy and convenient way to build your map application. You can go to ArcGIS online, create your content, put necessary layers, combine them together, provide the link to our map widget and it will automatically be recognized. Most layers are supported. Image services (ArcGIS Image Service Layer, Image Services Vector Layers, and WMS) and Tile services (Image Service, ArcGIS Tiled Map Service Layer, Web Tiled Layer, OpenStreetMap) are supported. Feature Services include map service (ArcGIS Feature Layer), KML, WFS, and CSV. We also provide some real-time services support like stream services (ArcGIS Stream Layer), GeoRSS, Vector Tiles (VectorTileLayer), and Bing Maps services. Two extra formats that are supported are GeoJSON and GPX.
Map Services
Services cannot be used without visualization. Our part in maps products is to provide visualization for these services. To start visualization, you need to create your map widget and specify different properties. One example of a system is CRS, which is a common coordinate system of displayed data. You can specify map limits if you want to limit the visualization area of interest. You can also set different adornments to your maps like map scale. Zoom settings include min/max with a range of scales available and time/speed to customize the map management to your convenience.
Map Layers
There are four main types of layers supported:
- Image type that displays a single image received from a server. For example, WMS for Web Maps Services and ArcGISImage supports ArcGIS MapServer and ImageServer services.
- With Tile layers, the data consists of several images (tiles) painted next to each other and thus forming a complete picture. Tile can be used as a universal layer for any tile service. Bing can be used for all Microsoft Bing Services.
- Vector layers draw not pictures but vector data (called “features”): points, polygons, and polylines, which depict cities, rivers, islands, and more. Support of different formats includes: GeoJSON, KML, CSV, GeoRSS, Lerc translate their format into the map objects, the ArcGISFeature supports ARCGIS FeatureServer services., WFS for Web Feature Services, and VectorTile.
- Shape layer is used for compatibility with other GeoToolkitJS elements to display on the map charts, contours, and other complex shapes (or just trivial ones).
Layer Settings
General setting for layers include url to the server or file, data coordinate system (epsg codes are supported), alpha as the value of the layer transparency, layerfilter for setting visibility conditions, tooltip.visible to enable tooltip support by the layer, and tooltip.formatter to generate information (in HTML format) of the tooltip content (can be used in both the basic GeoToolkitJS formatters or a custom one).
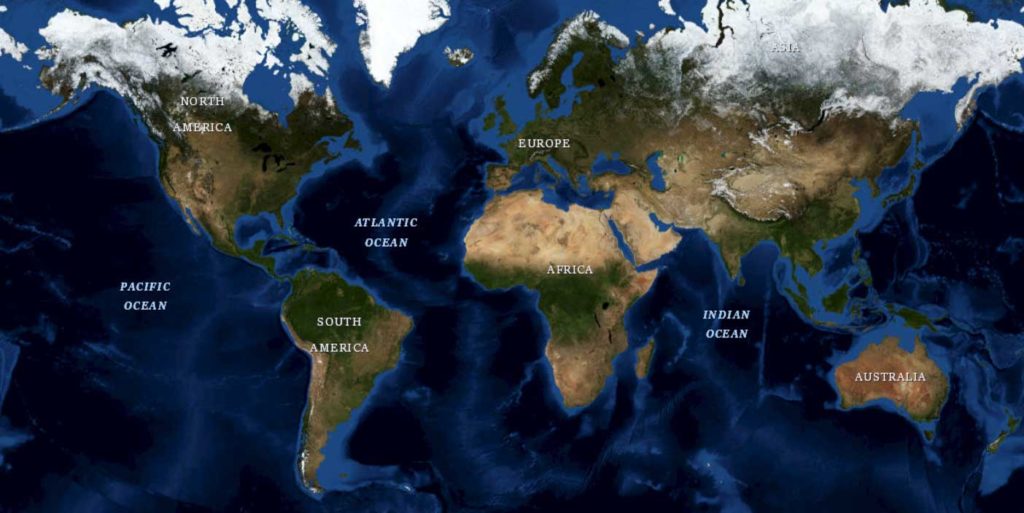
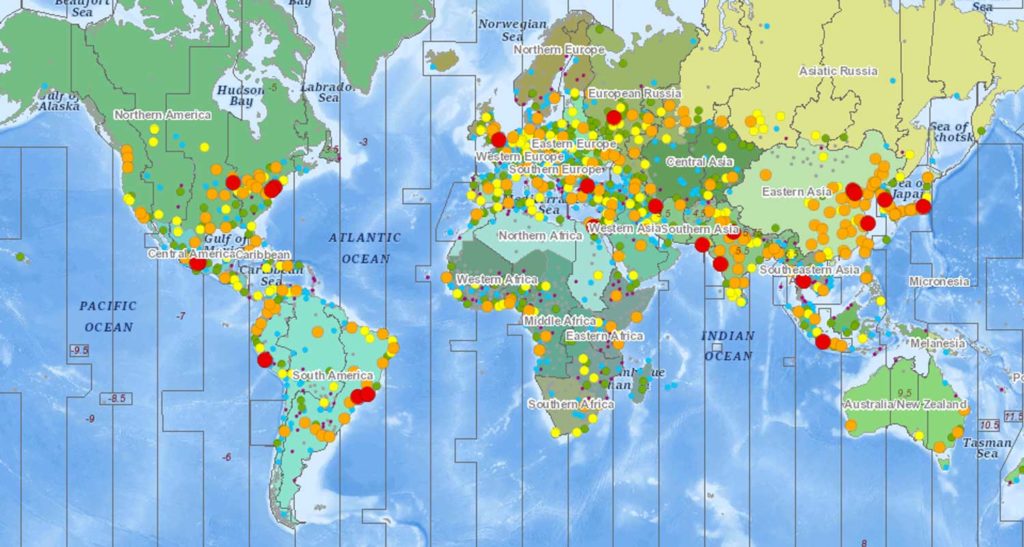
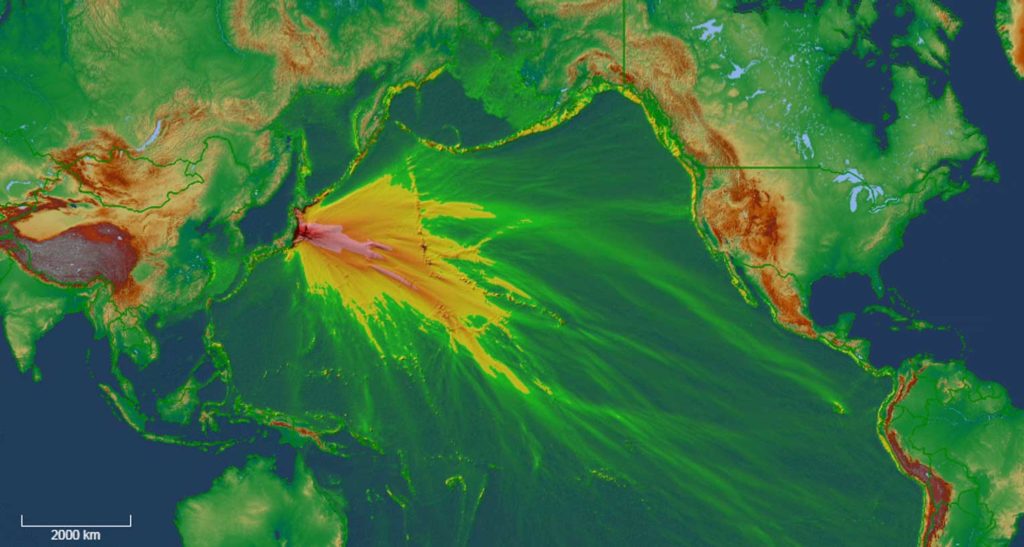
Examples of different layers:
Geo-Reference Images
Geotoolkit provides powerful options like fast WebGL implementation and ImageTransform to help speed up the process to transform any image in your application.
Feature Annotations
In map displays, you can have a lot of different annotations and some of them can potentially overlap. To help filter out the overlapped annotations, you want to use some collision detection to remove unnecessary labels. We provide all of these functionalities which can be configured. The steps to display labels are:
- Use annotations.visible layer property to include annotations (hidden by default)
- To select annotation info, change the annotation.strategy parameter to the AnnotationByAttribute or AnnotationByRule instance with the attribute name or \expression to display.
- Set the text shape for the template to customize annotations drawing styles and textSizeInfo option to dynamically resize annotations.
- Annotation filters prevent some information from being written in order to save space, time, etc.
Robust Map Features for Your Subsurface Application
Overall, GeoToolkit’s map widget allows you to integrate many robust map features into your subsurface or exploration applications. We hope this helps you simplify the process, meet usability expectations, and get the insights you need.
For more information on GeoToolkit’s maps widget and its features, please visit our GeoToolkit page.
Want to know more? Check out our webinar: Integrating Powerful Map Capabilities into Your Subsurface Web Applications.
