GeoToolkit is a suite of 2D and 3D data visualization libraries that display well log, seismic, contour, schematics, BHA, maps, and more in JavaScript. Released earlier this year, GeoToolkit.JS 2020 comes with various new features and significant improvements.
Highlights from the latest release include: improved ArcGIS support, faster load times, new tools, multilateral schematics, new gridding algorithms, and improved memory for volumetric rendering.
CARNAC
In Carnac, the base model of GeoToolkit, ES6 harmony modules support has been added. This allows client applications to be reduced in size and allows for a better integration with React and VUE frameworks. It also includes two sets of libraries for ES5 and ES6, two sets of demos and tutorials, two sets of API references, and new TypeScript headers for ES6.
GeoToolkit now also supports NPM. NPM provides local packages for ES5 and ES6 and simplifies the integration of GeoToolkit. Later this year, an INT-based NPM server will be provided (it is currently in the beta testing stage).
We’ve made migrating from ES5 to ES6 easy—just use the command line tool. We’ve also added support for different pyramid images (deep zoom image protocol, OSM, IIIF, and so on) to help with LOD for larger files. And we’ve implemented an Elastic zoom and scroll tool. Another new feature is the DataSheet widget where users can change the look and feel of the data, see table data, modify cells, merge cells, and highlight specific cells.
GeoToolkit.JS now also comes with support for automatic calculation of the desired axis size for charts like Bar Chart and support for CSS 2D transform and text transform for nodes based on AbstractNode. We added an HTTP layer to provide an abstraction API to make HTTP requests and integrate with existing API for Seismic, WellLog, and Contour.
MAP
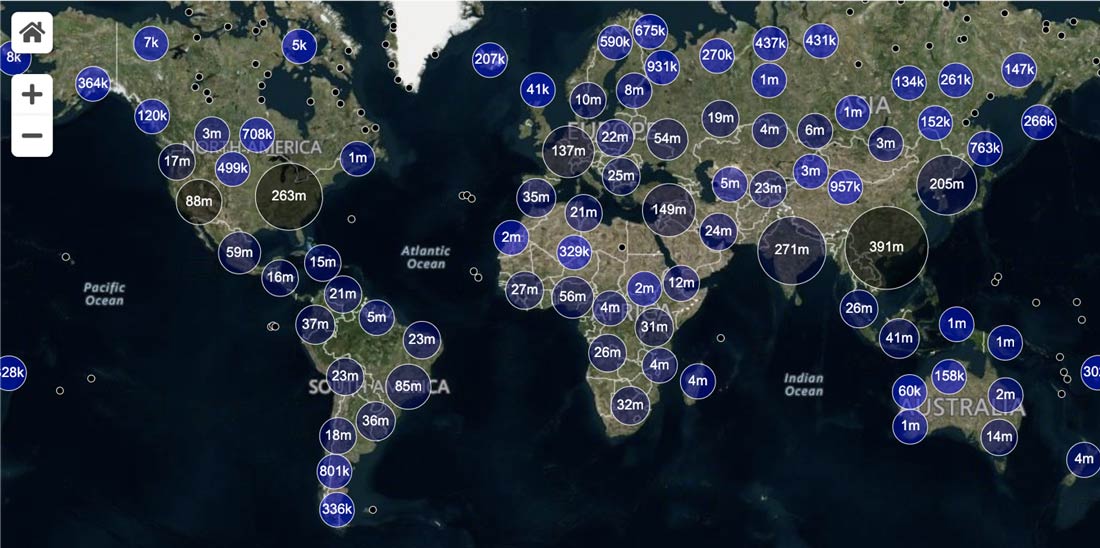
For our map libraries, new features include an infinite horizontal scroll, GPX format support, a tool to measure distances and area, added support for HTTP request headers (to GIS servers), the ability to create layers from configuration using JSON, an optional UI zoom control, improved ArcGIS support with added query/identify/legend API support for ArcGIS servers, added aggregation of symbols, and a create option to display highlighted features in the manipulation layer.
CARNAC 3D
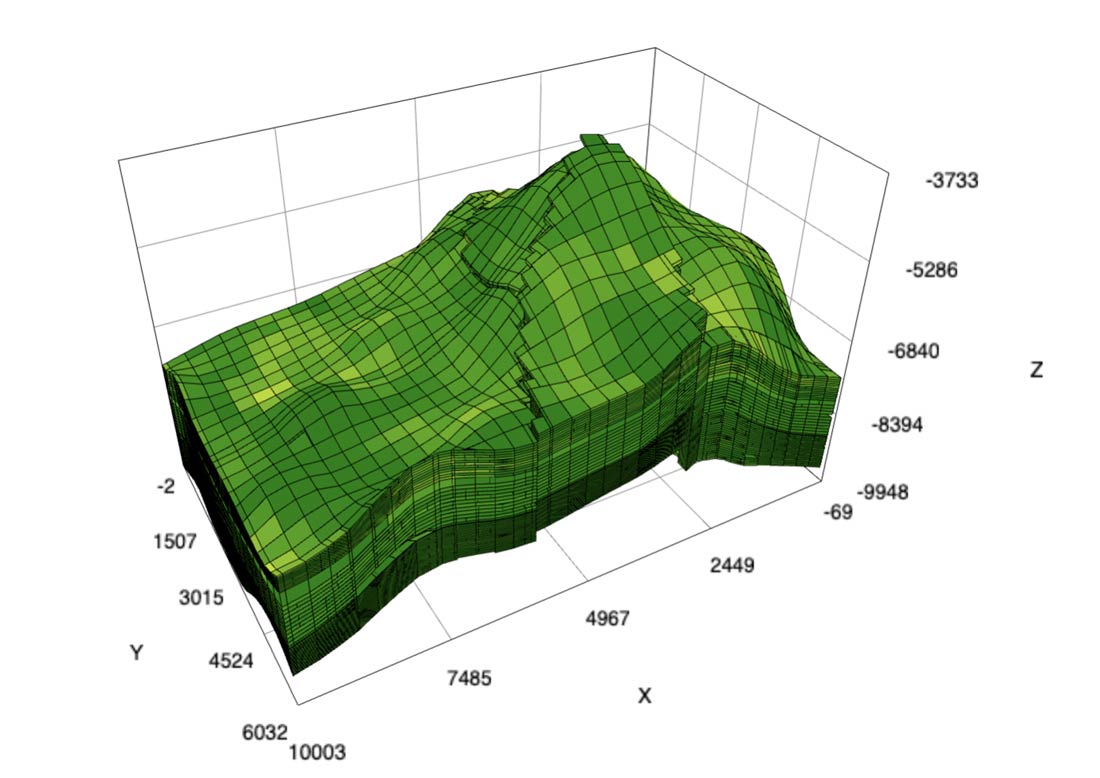
We improved the performance and memory usage for reservoirs, and we introduced the first version of client support for GigaGrid. We added label notations for wellbore as well as the ability to wrap the map on top of the elevation in 3D. Carnac 3D also comes with support for seismic slice in different directions. The Scatter Plot in Carnac 3D is optimized to use a larger number of points, support in picking and highlighting, and support for tooltips.
WELLLOG
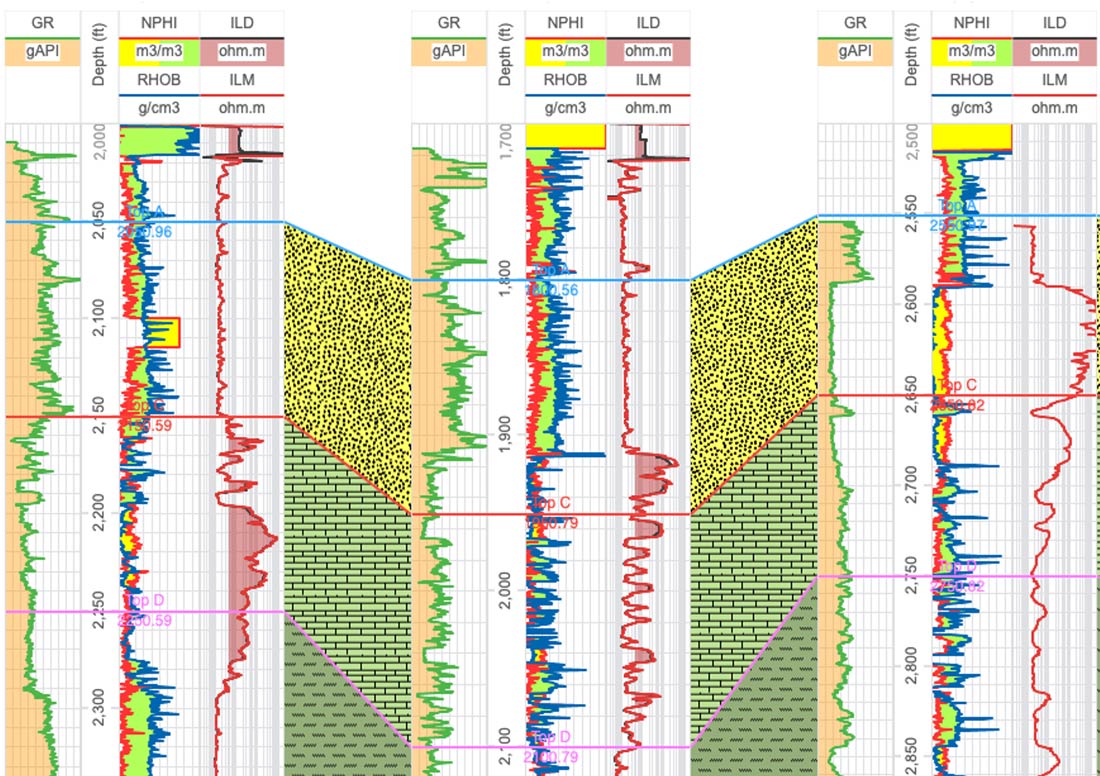
For the WellLog package, all demos were rewritten for both ES5 and ES6. The MultiWell library was optimized and improved. After multiple requests from customers, support for a ghost tool in deviated tracks has been added. Several modifications were done for the MultiWell widget, including modifying the algorithm for tops alignment, adding method to navigate to track, and implementing GAP Fill and Gap Disconnect for log curve and array log (log2d), and ArrayLog support in deviation.
The new drag and drop tool for MultiWellWidget allows you to drag and drop wells with several methods to mitigate for different positions of your correlation display and different alignments. We’ve updated WellLogWidget and MultiWellWidget to have a similar API so clients can play tracks, remove tracks, and so on the same way with both widgets. We’ve also reduced memory usage and increased performance of log2d visuals when exporting PDFs.
SEISMIC
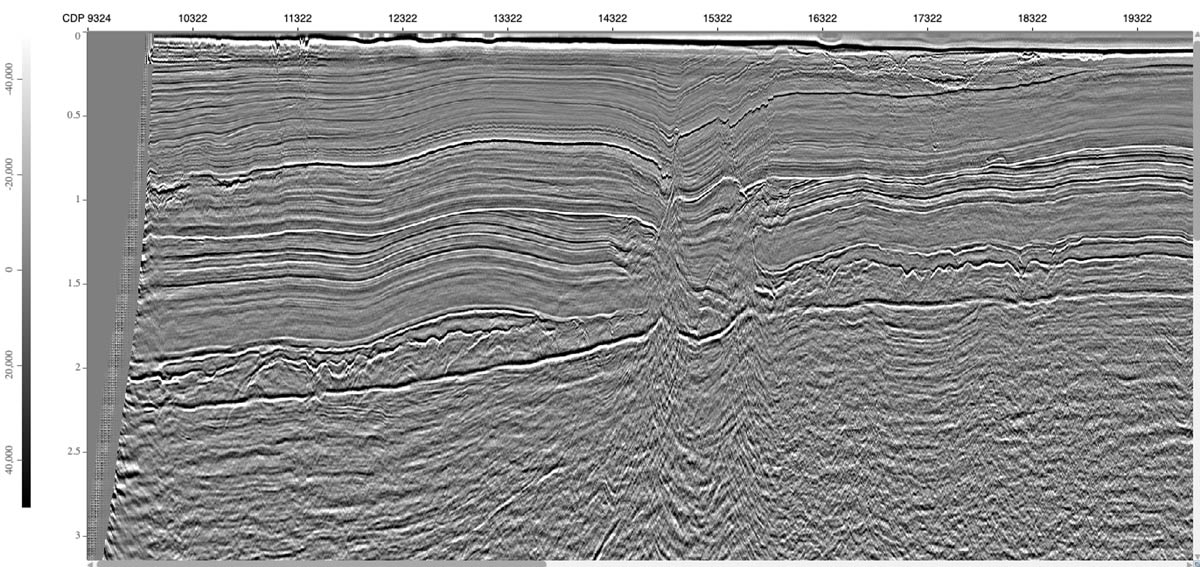
Seismic still has the same widget, but some elements were redesigned. New features in seismic include highlight of traces, floating elements in SeismicWidget toolbar, improved auxiliary chart, startValue as an option to MemoryReader. You can now also specify density decimation without wiggles and integrate webassembly seismic decompression for IVAAP connectors, which is two times faster compared to the JavaScript version. If your browser supports webassembly, you can automatically switch to webassembly mode for decompression.
SCHEMATIC
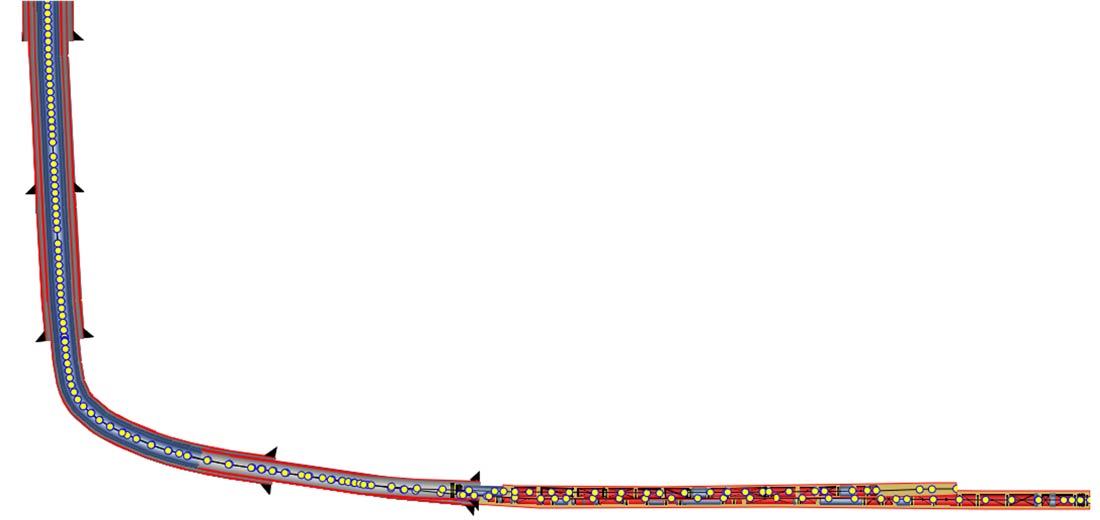
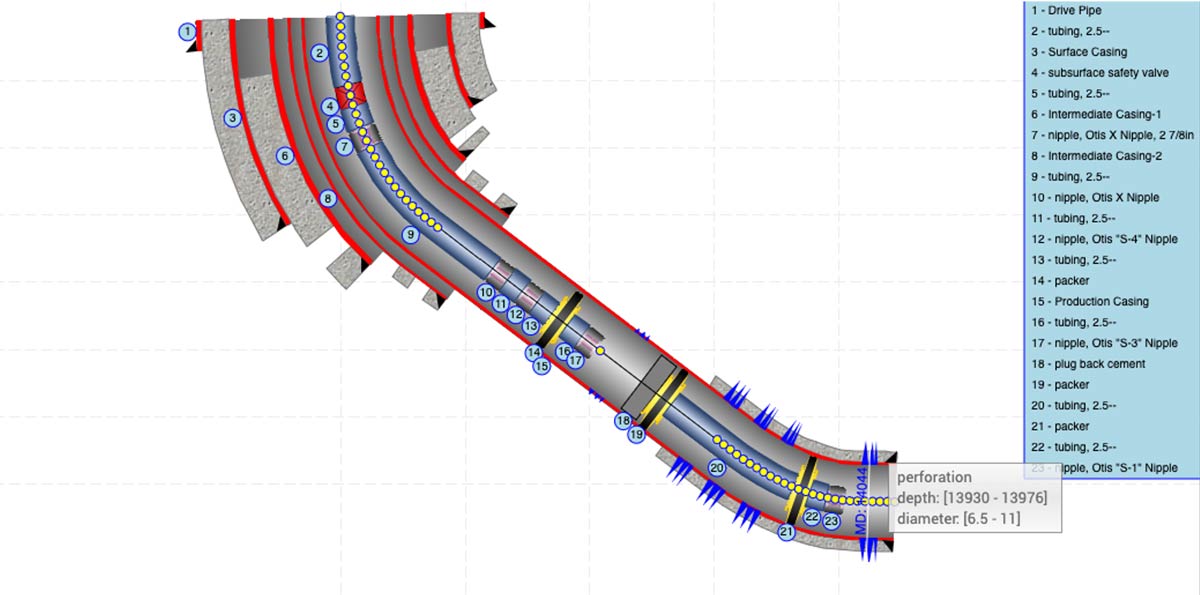
For the Schematic package, two new widgets have been introduced: Multilateral schematics and DeviatedSchematics widgets. There is now also support for units for WellSchematics for your data model and control for different labels and annotations based on components’ IDs that have been implemented.
CONTOUR
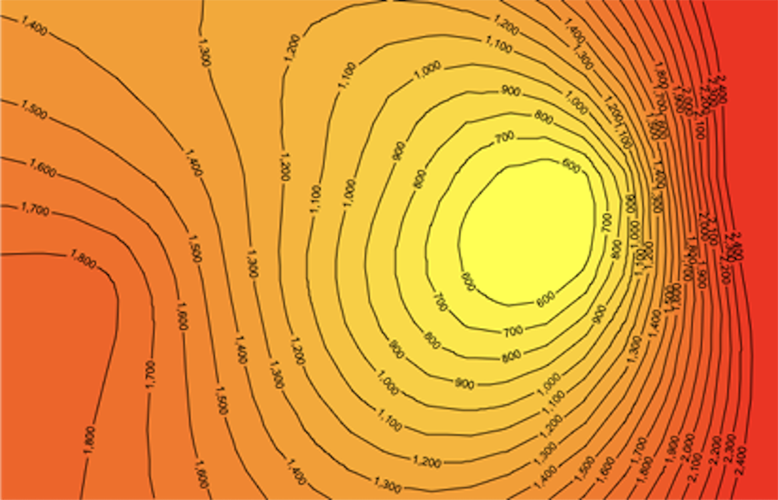
Gridding algorithms Kriging and ThinPlate have been added to Contour. GeoToolkit.JS can now display one isoline from contour and support multicolor isolines.
We are excited about the release of GeoToolkit.JS 2020 and would love to show you more about it. Contact us for a free trial at info@int.com.

