In this blog post, we will explore how IVAAP, a platform developed by INT, is revolutionizing the production geology workflow for geoscientists. GeomodL International, a consultancy based in the UAE, specializes in this field and has been utilizing IVAAP to enhance its production geology workflow. In this blog post, Raffik Lazar, founder and principal at GeomodL International, will share his insights on how IVAAP has helped streamline their production geology workflow, allowing them to visualize and cross-visualize various data sets in a single location, leading to better decision-making, cost-saving, and optimization of development plans.
Reservoir Lifecycle and Production Geology Workflow
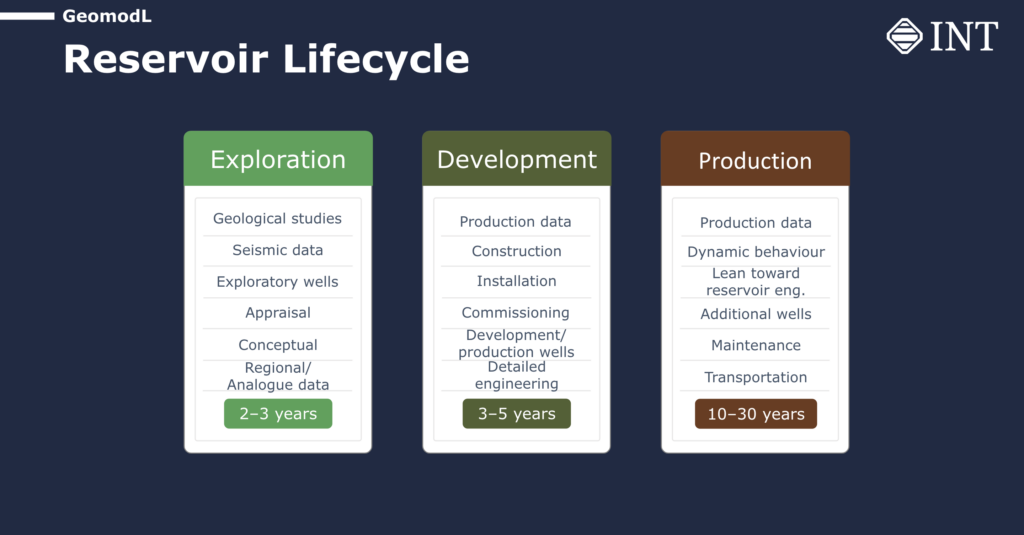
As many of you know, the reservoir lifecycle typically starts with exploration, which can take two to three years. During this phase, geoscientists rely heavily on seismic data to understand the basin’s geology. Exploration wells are drilled, and projections of the reservoir are developed. Once an asset is identified to be commercially relevant, the project transitions into the development phase, which can take three to five years on average. During this phase, wells are drilled, and surface structures are commissioned. Production data starts to become available, providing insights into the behavior of the reservoir. The production phase, which can last for 10 to 30 years, involves drilling additional wells within the same field based on the dynamic behavior of the reservoir and refining the static model with the help of geology and geophysics (G&G) data and production data.
Challenges in Production Geology Workflow
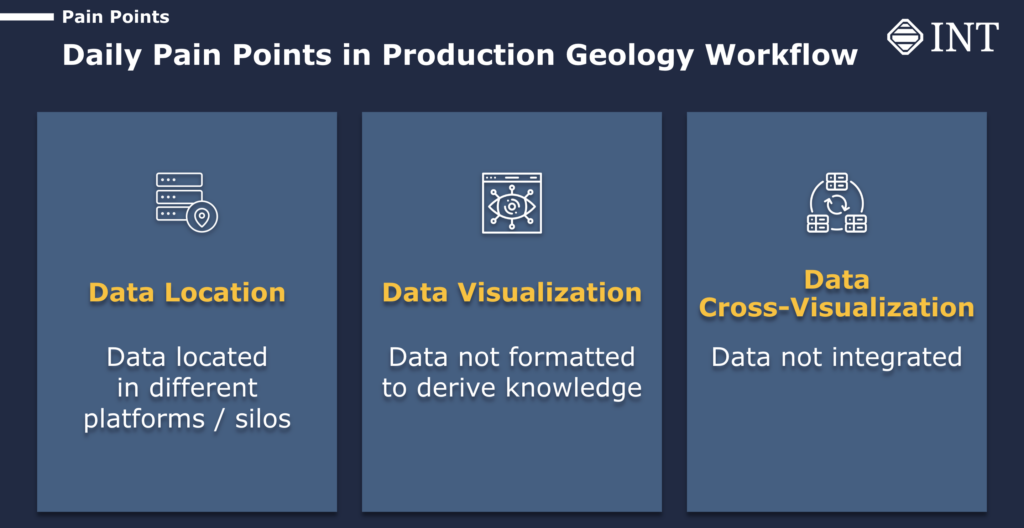
One of the challenges in the production geology workflow is the fragmented nature of data, which is typically located in different platforms or silos. Production data is often in Excel formats, while G&G data may be stored in Petrel or other data sets, making it difficult to visualize and analyze the data in an integrated manner. Additionally, the time-consuming process of manually cross-visualizing data from different sources hinders the geoscientists’ ability to gain insights and make informed decisions quickly.
The Power of Data Visualization with IVAAP
IVAAP, a web-based platform developed by INT, has emerged as a game-changer in production geology. It provides geoscientists with a single platform to access and visualize various data sets, including production data, G&G data, and 3D models, all in one location. This eliminates the need to manually search for and integrate data from different sources, saving time and effort. With IVAAP, geoscientists can easily cross-visualize data, allowing them to gain insights far more effectively than looking at each data set in isolation. The ability to visualize data in a comprehensive and integrated manner enables geoscientists to understand the behavior of the reservoir better and make informed decisions for development plans, leading to cost-saving and optimization of resources.
Case Study: Coevorden Field
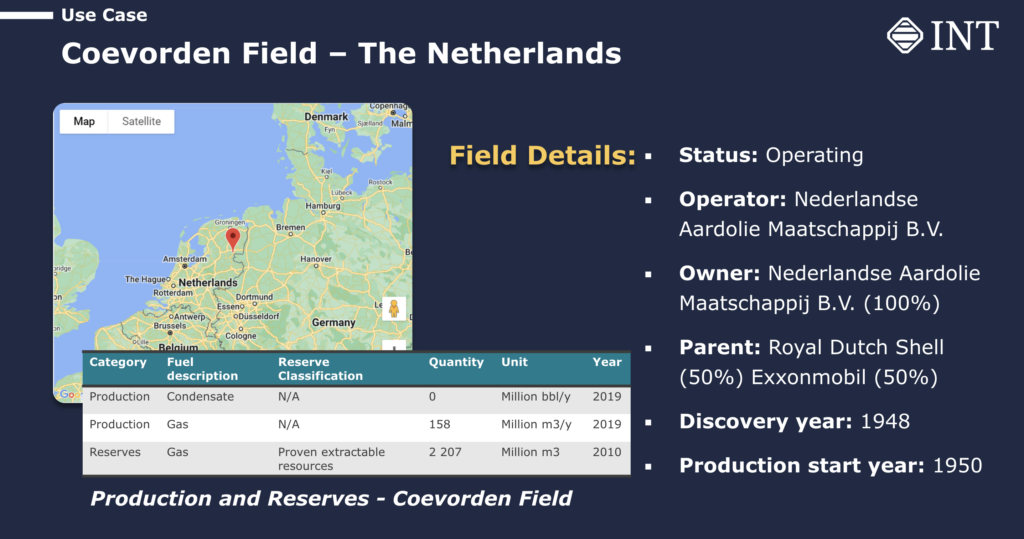
To illustrate the power of IVAAP in streamlining the production geology workflow, let’s look at the case study of the Coevorden Field, a gas field in the Netherlands. This field is still operating as a joint venture between Shell and ExxonMobil and is considered a very mature field with significant gas reserves. GeomodL International used IVAAP to analyze the production data, G&G data, and 3D models of the Coevorden Field.
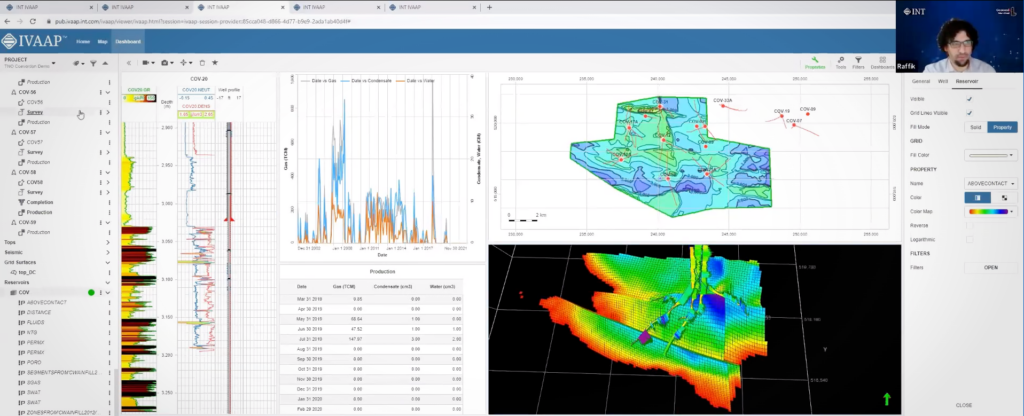
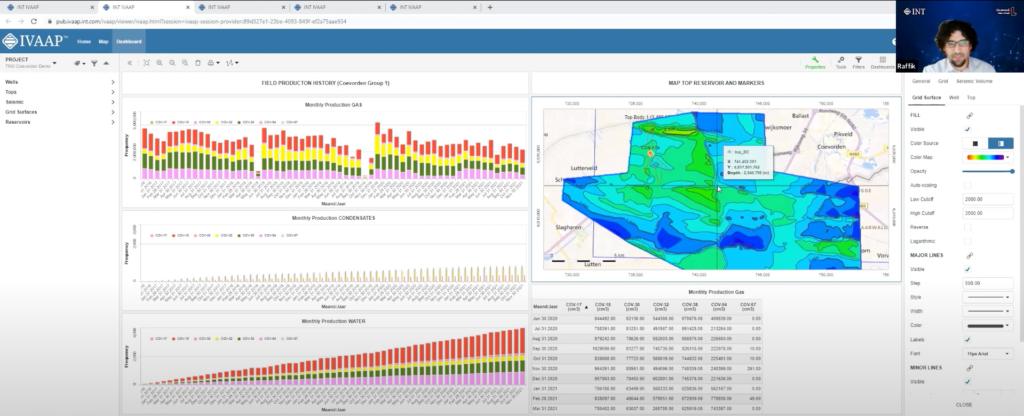
IVAAP is a web-based platform accessible through a modern browser that supports HTML5 and WebSockets, eliminating the need for specific hardware or a powerful machine to perform complex analyses. Upon launching IVAAP, users are greeted with dashboards that can be opened individually to access various tools and functionalities. The dashboards are organized with data on the left, parameters and settings on the right, and widgets such as charts, maps, and 3D windows in the middle.
The first dashboard that proves beneficial for geologists is the production dashboard. It allows users to visualize the performance of wells in the field over time. Users can adjust settings such as the time period and view production data for individual wells or groups of wells. For example, users can track the cumulative production of a group of wells on a monthly or yearly basis and even compare gas production with condensate and water production. The dashboard provides interactive tools to manipulate and analyze the data, such as adjusting time periods to understand the production trends in the field comprehensively.
Watch the complete use case here.
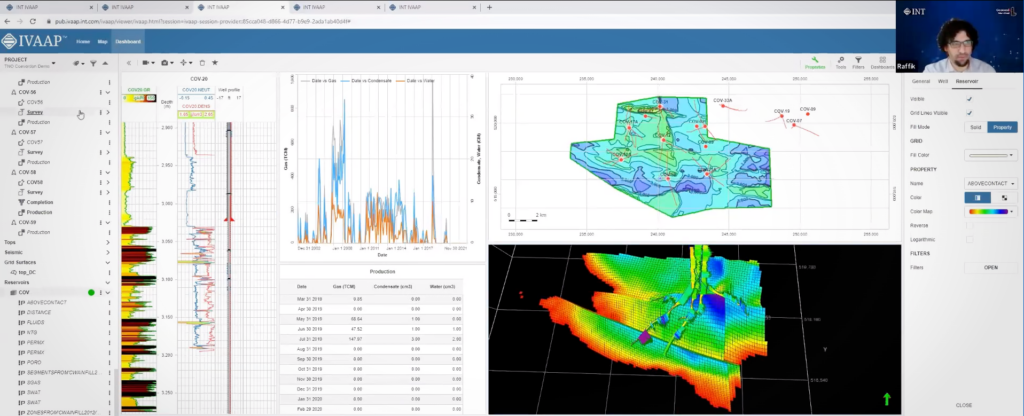
The second dashboard in IVAAP provides more detailed well-level information. Users can access individual well data, including production curves, well logs, and 3D models of the reservoir. The 3D window allows for seamless zooming in and out, and users can interact with the well logs and maps in a synchronized manner. For example, users can view the location of perforations and casing shoes in the well schematic and simultaneously see the corresponding changes in the well logs. This integrated approach allows geologists to analyze production data in the context of the reservoir model, enabling a more comprehensive understanding of the field’s performance.
One of the notable features of IVAAP is its ability to provide a holistic view of the field’s data under the same roof. Geologists and reservoir engineers can access 3D models, top reservoir maps, well schematics, well logs, and production data in one platform. This integrated approach streamlines the analysis process and allows for a more efficient workflow, saving time and resources.
Watch the complete use case here.
As the industry continues to evolve and face new challenges, platforms like IVAAP provide a cutting-edge solution for geoscientists to manage complex data and make informed decisions effectively. By harnessing the power of technology, geoscientists can unlock the full potential of their reservoirs, leading to improved exploration, appraisal, and development strategies. With IVAAP, geoscientists can confidently navigate the reservoir life cycle from exploration to mature fields and drive greater success in oil and gas operations, all from a single point of access.
Visit us online at int.com/ivaap for a preview of IVAAP or for a demo of INT’s other data visualization products.
For more information, please visit www.int.com or contact us at intinfo@int.com.
____________
ABOUT INT
INT software empowers energy companies to visualize their complex data (geoscience, well, surface reservoir, equipment in 2D/3D). INT offers a visualization platform (IVAAP) and libraries (GeoToolkit) that developers can use with their data ecosystem to deliver subsurface solutions (Exploration, Drilling, Production). INT’s powerful HTML5/JavaScript technology can be used for data aggregation, API services, and high-performance visualization of G&G and energy data in a browser. INT simplifies complex subsurface data visualization.
INT, the INT logo, and IVAAP are trademarks of Interactive Network Technologies, Inc., in the United States and/or other countries.
