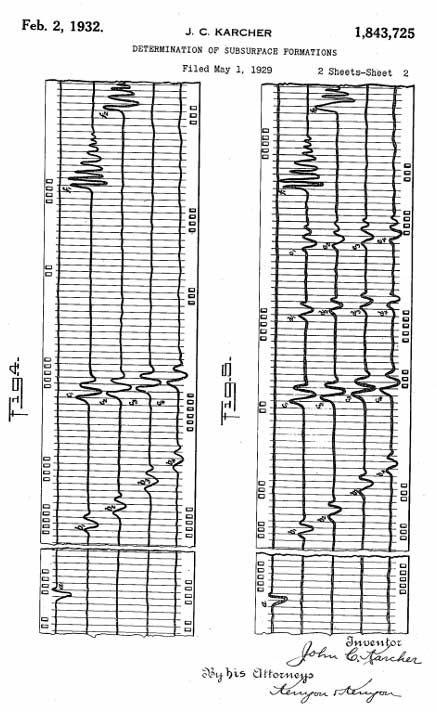
The oil and gas industry is historically one of the first industries generating actionable data in the modern sense. For example, the first seismic imaging was done in 1932 by John Karcher.

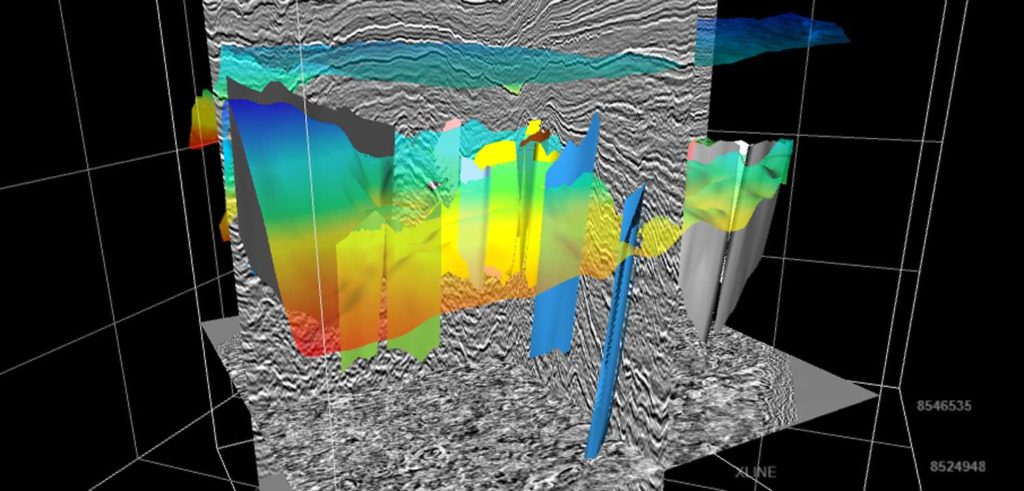
Since that first primitive image, seismic data has been digitized and has grown exponentially in size. It is usually represented in monolith data sets which may span in size from a couple of gigabytes to petabytes if pre-stack.

The long history, large amount of data, and the nature of the data pose unique challenges that often make it difficult to take advantage of advancing cloud technology. Here is a high-level overview of the challenges of working with oil and gas data and some possible solutions to help companies take advantage of the latest cloud technologies.
Problems with Current Data Management Systems
Oil and Gas companies are truly global companies, and the data is often distributed among multiple disconnected systems in multiple locations. This not only makes it difficult to find and retrieve data when necessary but also makes it difficult to know what data is available and how useful it is. This often requires person-to-person communication, and some data may even be in offline systems or on someone’s desk.
The glue between those systems is data managers who are amazing at what they do but still introduce a human factor to the process. They have to understand which dataset is being requested, then search for it on various systems, and finally deliver it to the original requester. How much does this process take? You guessed it—way too much! And in the end, the requester may realize that it’s not the data they were hoping to get, and the whole process is back to square one.
After the interpretation and exploration process, decisions are usually made on the basis of data screenshots and cherry-picked views, which limit the ability of specialists to make informed decisions. Making bad decisions based on incomplete or limited data can be very expensive. This problem would not exist if the data was easily accessible in real-time.
And that doesn’t even factor in collaboration between teams and countries.
How can O&G and service companies manage
their massive subsurface datasets better
by leveraging modern cloud technologies?
3 Key Components of Subsurface Data Lake Implementation
There are three critical components of a successful subsurface data lake implementation: a strong cloud infrastructure, a common data standard, and robust analysis and visualization capabilities.
AWS: Massive Cloud Architecture
While IVAAP is compatible with any cloud provider—along with on-premise and hybrid installations—AWS offers a strong distributed cloud infrastructure, reliable storage, compute, and more than 150 other services to empower cloud workflows.
OSDU: Standardizing Data for the Cloud
The OSDU Forum is an Energy Industry Forum formed to establish an open subsurface Reference Architecture, including a cloud-native subsurface data platform reference architecture, with usable implementations for major cloud providers. It includes Application Standards (APIs) to ensure that all applications (microservices), developed by various parties, can run on any OSDU data platform, and it leverages Industry Data Standards for frictionless integration and data access. The goal of OSDU is to bring all existing formats and standards under one umbrella which can be used by everyone, while still supporting legacy applications and workflows.
IVAAP: Empowering Data Visualization
A data visualization and analysis platform such as IVAAP, which is the third key component to a successful data lake implementation, provides industry-leading tools for data discovery, visualization, and collaboration. IVAAP also offers integrations with various Machine Learning and artificial intelligence workflows, enabling novel ways of working with data in the cloud.
Modern Visualization — The Front End to Your Data
To visualize seismic data, as well as other types of data, in the cloud, INT has developed a native web visualization platform called IVAAP. IVAAP consists of a front-end client application as well as a backend. The backend takes care of accessing, reading, and preparing data for visualization. The client application provides a set of widgets and UI components empowering search, visualization, and collaboration for its users. The data reading and other low-level functions are abstracted from the client by a Domain API, and work through connector microservices on the backend. To provide support for a new data type, you only need to create a new connector. Both parts provide an SDK for developers, and some other perks as well.
Compute Close to Your Data
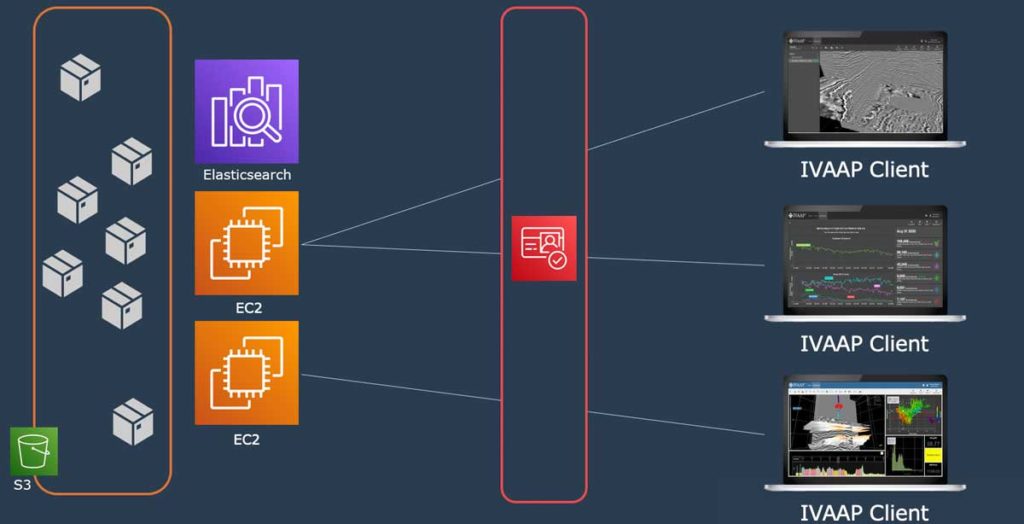
Once the data is in the cloud, a variety of services become available. For example, one of them is ElasticSearch from AWS, which helps index the data and provides a search interface. Another service that becomes available is AWS EC2, which provides compute resources that are as distributed as the data is. That’s where IVAAP gets installed.
One of the cloud computing principles is that data has a lot of gravity and all the computing parts tend to get closer to it. This means that it is better to place the processing computer as close to the data as possible. With AWS EC2, we at INT can place our back end very close to the data, regardless of where it is in the world, minimizing latency for the user and enabling on-demand access. Elastic compute resources also enable us to scale up when the usage increases and down when fewer users are active.
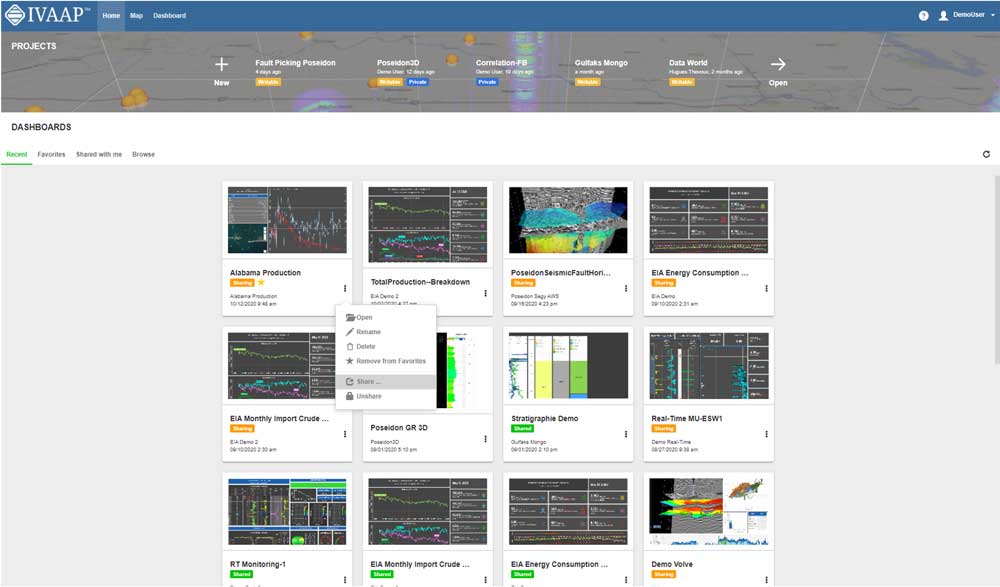
All of this works together to make your data on-demand—when the data needs to be presented, all the tools and technologies mentioned above come into play, visualizing the necessary data in minutes, or even seconds, with IVAAP dashboards and templates. And of course, the entire setup is secure on every level.
Empower Search and Discovery
The next step is to make use of this data. And to do so, we need to provide users a way to discover it. What should be made searchable, how to set up a search, and how to expose the search to the users?
Since searching through numerical values of the data won’t provide a lot of discovery potential, we need some additional metadata. This metadata is extracted along with the data and also uploaded to the cloud. All of it or a subset of metadata is then indexed using AWS Elasticsearch. IVAAP uses an Elasticsearch connector to the search, as well as tools to invoke the search through an interactive map interface or filter forms presented to the user.
How can you optimize web performance of massive domain datasets?
Visualizing Seismic Datasets on the Web
There are two very different approaches to visualizing data. One is to do it on the server and send rendered images to the client. This process lacks interactivity, which limits the decisions that can be made from those views. The other option is to send data to the client and visualize it on the user’s machine. IVAAP implements either approach.
While the preferred method—sending data to the client’s machine—provides limitless interactivity and responsiveness of the visuals, it also poses a special challenge: the data is just too big. Transferring terabytes of data from the server to the user would mean serious problems. So how do we solve this challenge?
First, it is important to understand that not all the data is always visible. We can calculate which part of the data is visible on the user’s screen at any given moment and only request that part. Some of the newer data formats are designed to operate with such reads and provide ways to do chunk reads out of the box. A lot of legacy data formats—for example, SEG-Y—are often unstructured. To properly calculate and read the location of the desired chunk, we need to first have a map—called an Index—that is used to calculate the offset and the size of chunks to be read. Even then, the data might still be too large.
Luckily, we don’t always need the whole resolution. If a user’s screen is 3,000 pixels wide, they won’t be able to display all 6,000 traces, so we can then adaptively decrease the number of traces to provide for optimal performance.
Often the chunks which we read are in different places in the file, making it necessary to do multiple reads at the same time. Luckily, both S3 storage and IVAAP support such behavior. We can fire off thousands of requests in parallel, maximizing the efficiency of the network. Live it to the full, as some people like to say. And even then, once the traces are picked and ready to ship, we do some vectorized compression before shipping the data to the client.
We were talking about legacy file formats here, but it’s worth mentioning that GPU compression is also available for newer file formats like VDS/OpenVDS and ZGY/OpenZGY. It’s worth mentioning that the newer formats provide perks like brick storage format, random access patterns, adaptive level of detail, and more.
Once the data reaches the client, JavaScript and Web Assembly technologies come together to decompress the data. The data is then presented to the user using the same technologies through some beautiful widgets, providing interactivity and a lot of control. From there, building a dashboard—drilling, production monitoring, exploration, etc.—with live data takes minutes.
All the mentioned processes are automated and require minimal human management. With all the work mentioned above, we enable a user to search for the data of interest, add it to desired visualization widgets (multiple are available for each type of data), and display on their screen with a set of interactive tools to manipulate the visuals. All within minutes, and while being in their home office.
That’s not all—a user can save the visualizations and data states into a dashboard and share it with their colleagues sitting on a different continent, who can then open the exact same view in a matter of minutes. With more teams working remotely, this seamless collaboration helps facilitate collaboration and reduce data redundancy and errors.
Data Security
How do we keep this data secure? There are two layers of authentication and authorization implemented in such a system. First, AWS S3 has identity-based access guarantees that data can be visible to only authorized requests. IVAAP uses OAuth2 integrated with AWS Cognito to authenticate the user and authorize the requests. The user logs into the application and gets a couple of tokens that allow them to communicate with IVAAP services. The client passes tokens back to the IVAAP server. In the back end, IVAAP validates the same tokens with AWS Cognito whenever data reads need to happen. When validated, a new, temporary signed access token is issued by S3, which IVAAP uses to make the read from the file in a bucket.
Takeaways
Moving to the cloud isn’t a very simple task and poses a lot of challenges. By using technology provided by AWS and INT’s IVAAP and underlined by OSDU data standardization, we can create a low-latency data QC and visualization system which puts all the data into one place, provides tools to search for data of interest, enables real-time on-demand access to the data from any location with the Internet, and does all that in a secure manner.
For more information on IVAAP, please visit int.com/ivaap/ or to learn more about how INT works with AWS to facilitate subsurface data visualization, check out our webinar, “A New Era in O&G: Critical Components of Bringing Subsurface Data to the Cloud.”


