Click on the links below to skip to a specific section.
What Is IVAAP? [Overview]
Webinar: Simplifying Geoscience ML Integration to Deliver End-to-End Workflows
Webinar: A New Era in O&G: Critical Components of Bringing Subsurface Data to the Cloud
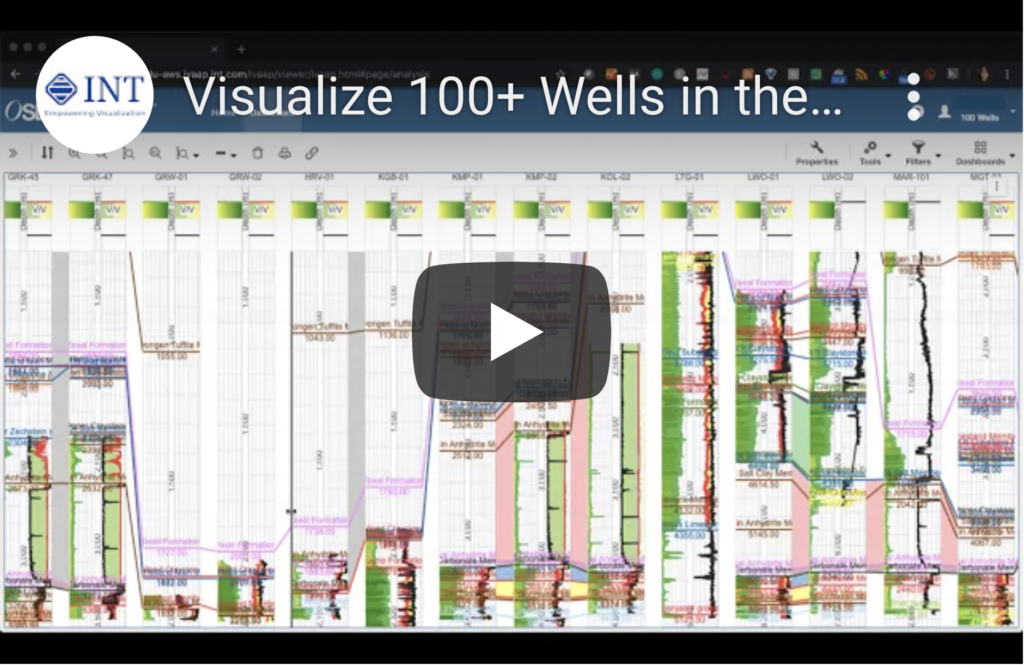
Visualize 100+ Wells in the Cloud with IVAAP, OSDU, and AWS
Upstream Data Visualization on Azure
IVAAP Visualization on OSDU R3 (Mercury)
IVAAP Demo Supporting OSDU Release 2 Deployed on AWS
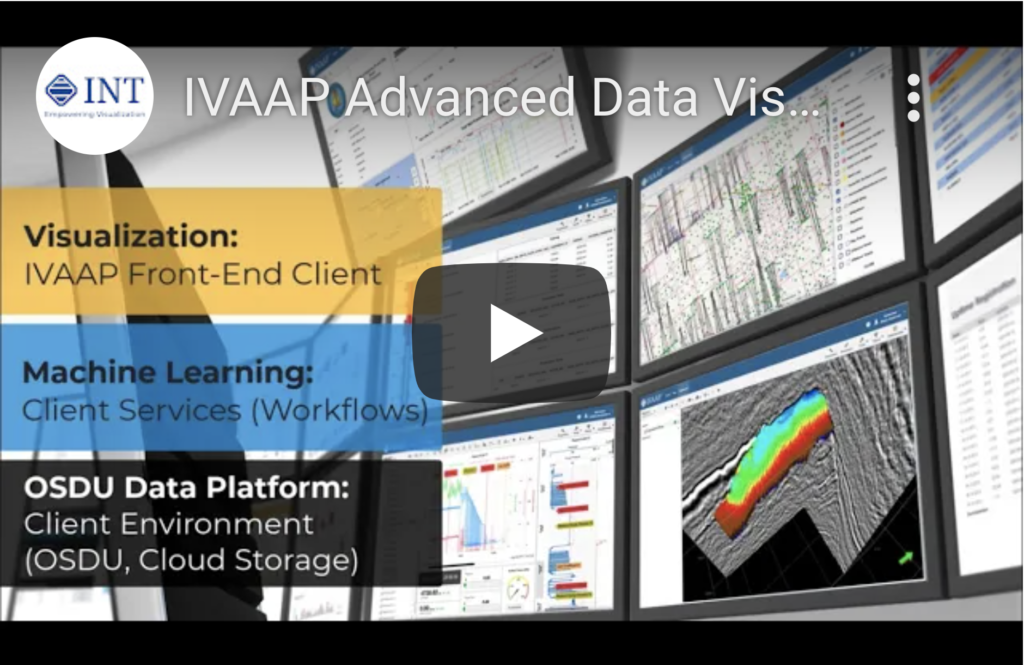
OSDU Visualized on the IVAAP Platform
New Features in IVAAP’s Advanced Upstream Data Visualization Platform
The most versatile enterprise cloud viewer for E&P, IVAAP™ is an HTML5 visualization framework that integrates seamlessly with your upstream E&P solutions to access and visualize your data—domain, G&G, drilling, production, WellLog, 3D, schematics, seismic, and more.
IVAAP 2.8
IVAAP 2.7
IVAAP 2.6
IVAAP 2.5
IVAAP 2.4
IVAAP 2.3
IVAAP 2.0
IVAAP 1.0
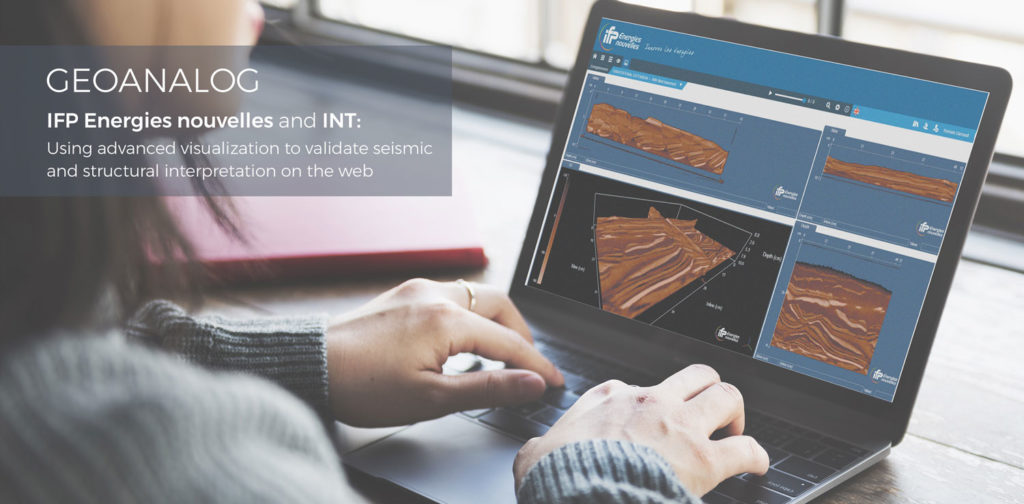
Don’t just take our word for it—learn more about how some of the industry’s leading companies have used our advanced data visualization platform to create a single point of access to their data in the cloud.
Webinar: GeoToolkit.JS 2021
Webinar: Integrating Powerful Map Capabilities in Your Subsurface Web Applications
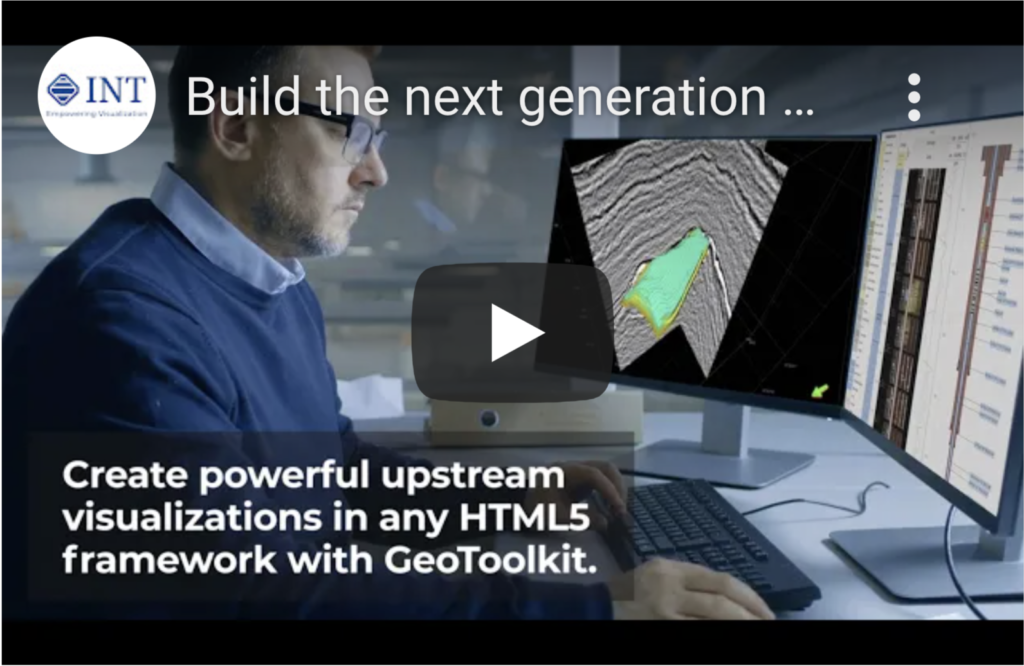
Build the next generation of G&G and petrophysical HTML5 data visualization
Webinar: GeoToolkit.JS 2020 Overview
GeoToolkit provides an extensive set of sophisticated tools for visualization and analysis of complex data on everything from desktops to mobile devices, written in Javascript for HTML5 deployment, along with .NET, C++, and Java.
GeoToolkit.JS 2021
GeoToolkit.JS 2020.1
GeoToolkit.JS 2020
GeoToolkit.JS 2.6
GeoToolkit.JS 2.5
GeoToolkit.JS 2.4
GeoToolkit.JS 2.3
GeoToolkit.NET 3.9
GeoToolkit.NET 3.8
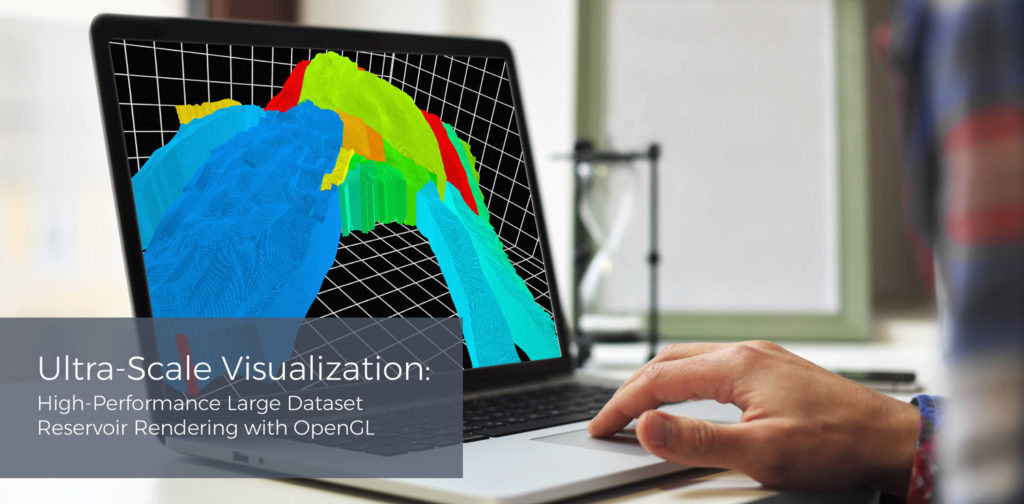
Don’t just take our word for it—learn more about how some of the industry’s leading companies have used our advanced data visualization toolkits to build or expand robust data visualization applications.
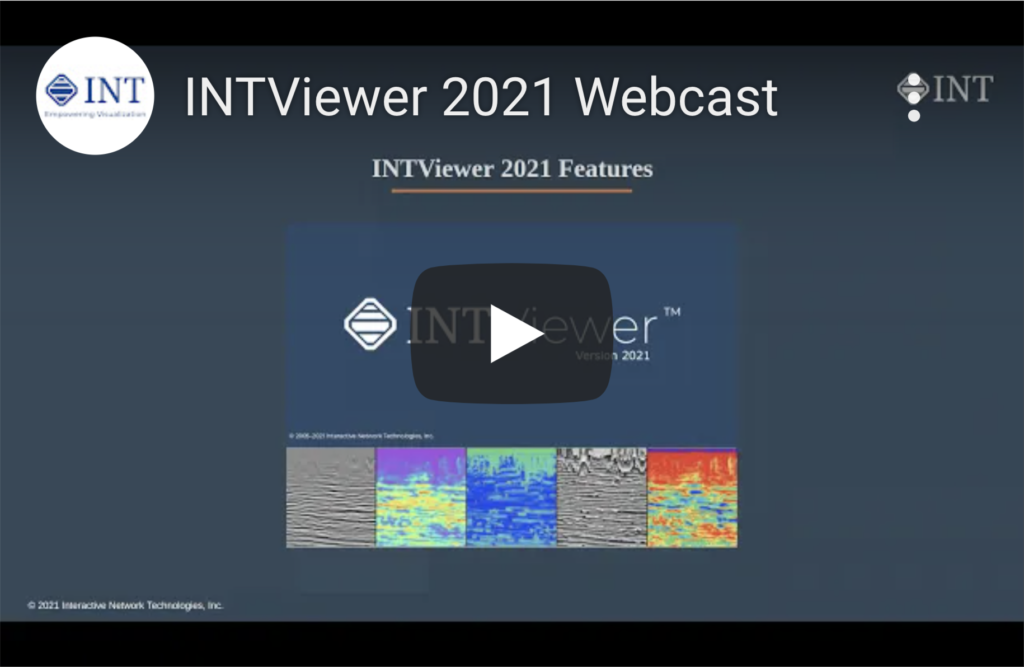
Webinar: INTViewer 2021
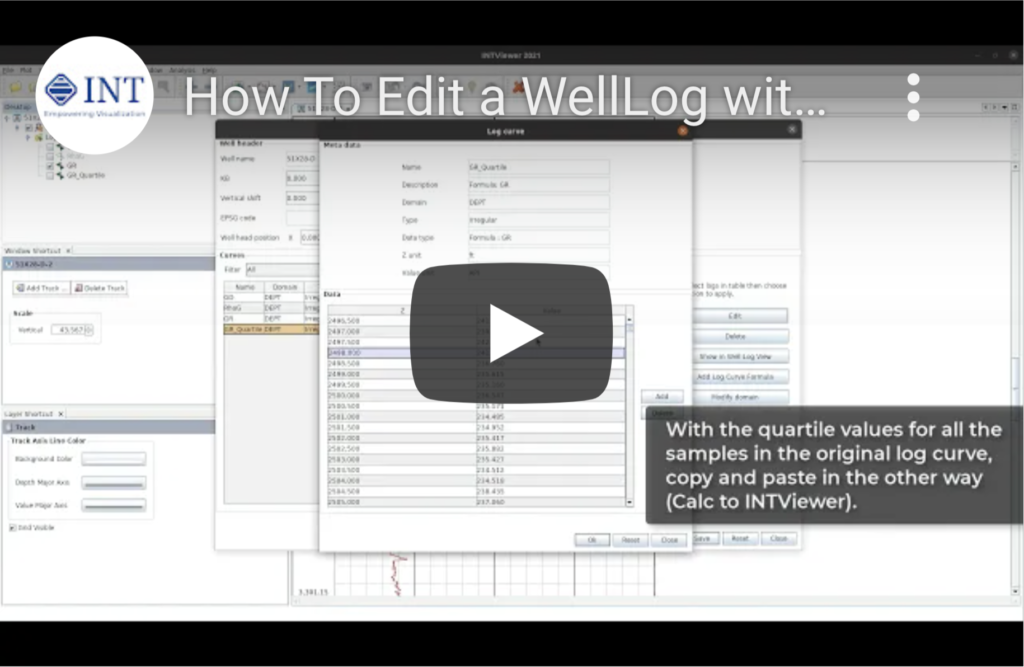
How to Edit a WellLog with INTViewer
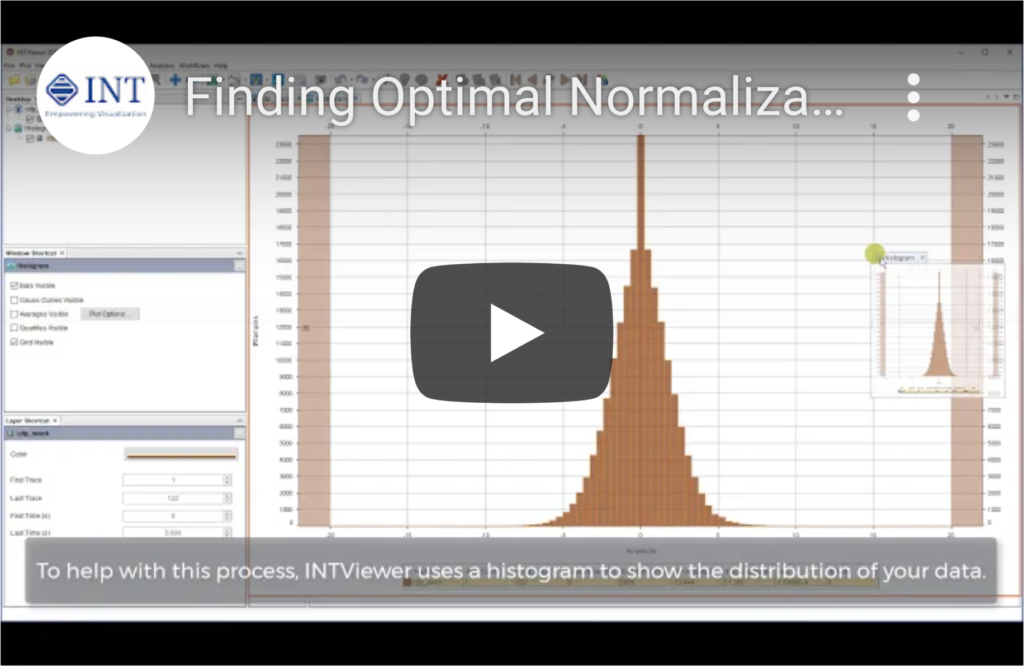
Finding Optimal Normalization Limits with INTViewer
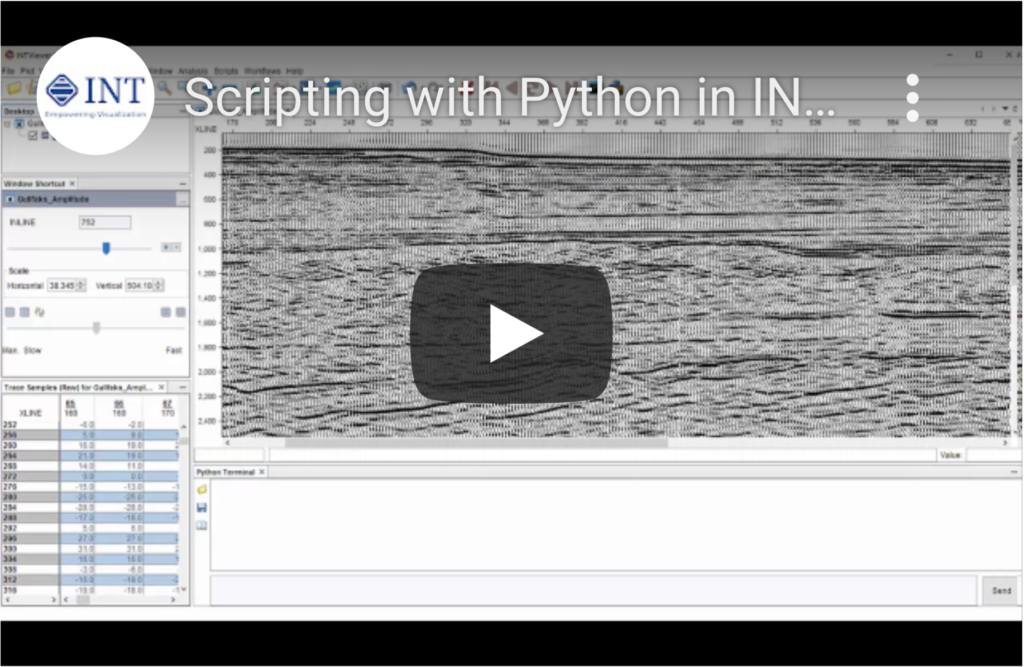
Scripting with Python in INTViewer
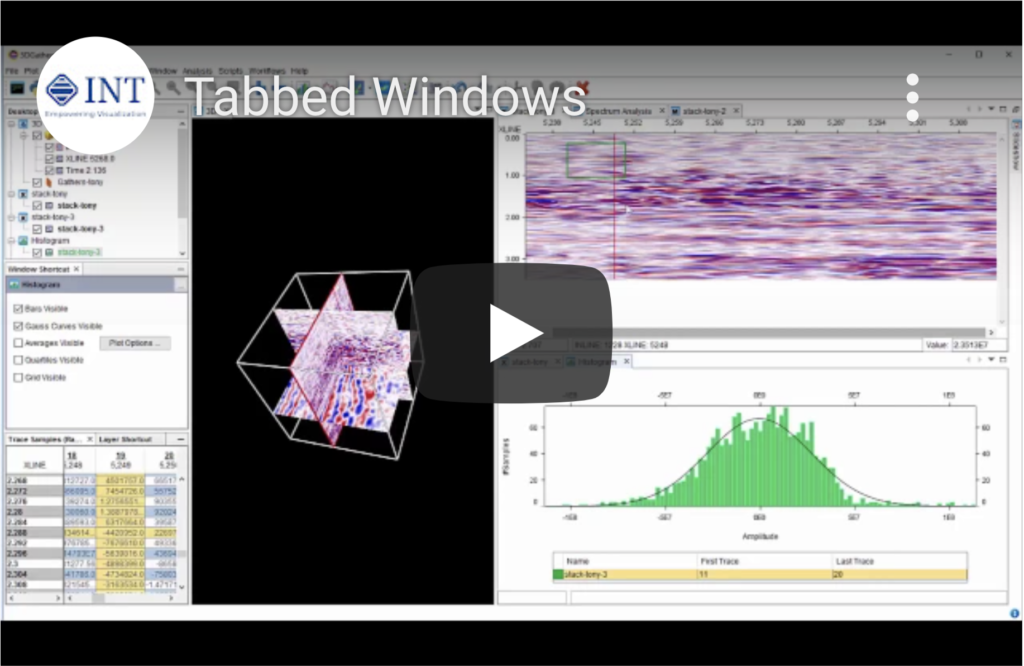
Working with Tabbed Windows in INTViewer
INTViewer Slideshow Plugin
Exporting Seismic Datasets in INTViewer
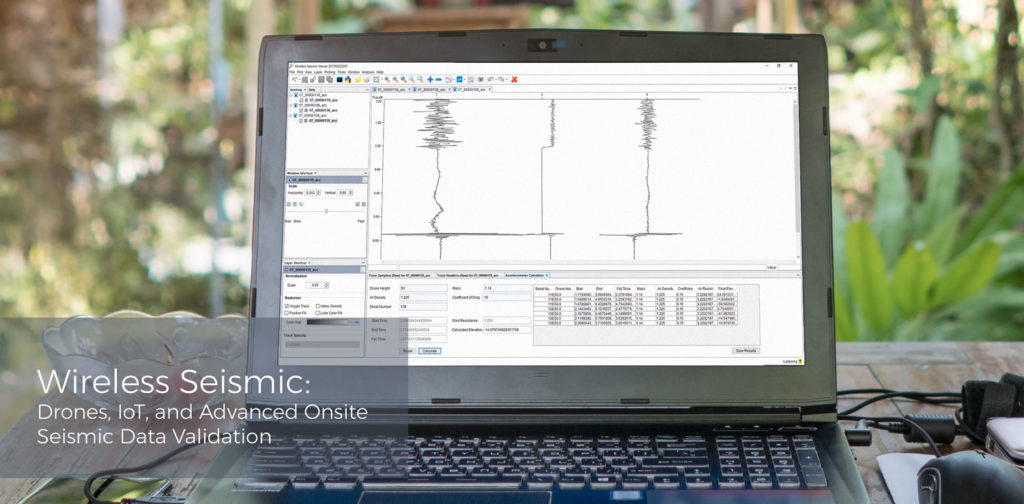
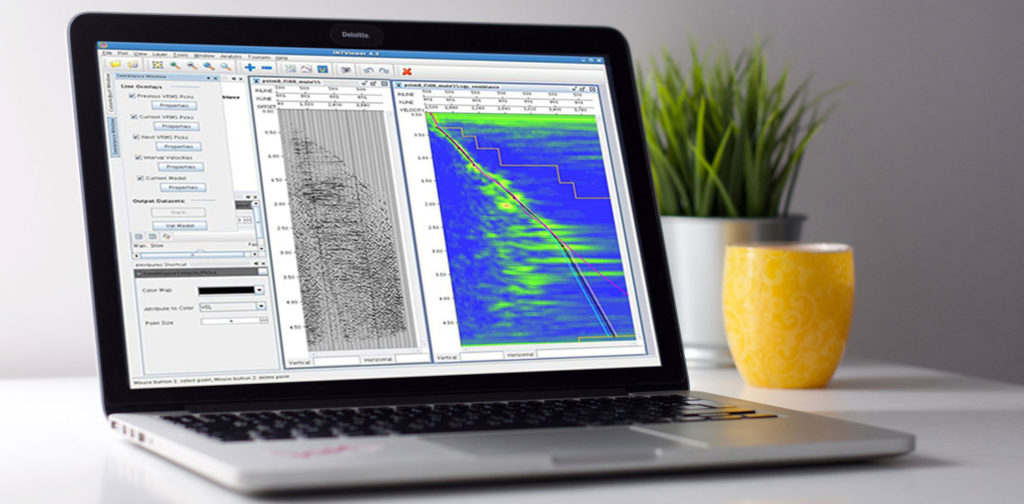
INTViewer is a desktop application and platform that allows you to view your seismic data, check for errors, confirm geospatial integrity, perform light processing, and analyze your dataset—quickly and on the go.
INTViewer 2021
INTViewer 2019
INTViewer 2018
INTViewer Plugins
INTViewer for Plugin Developers
Scripting INTViewer with Python
Don’t just take our word for it—learn more about how some of the industry’s leading companies have used our geoscience platform to QA/QC their data on the fly.
Our extensive libraries and customizable widgets make building a tool, application, or dashboard to fit your specific needs an easy process. INT’s knowledgeable team will work side-by-side with you to gather requirements, help define your needs, and deliver custom solutions with the lowest risk and highest reward of any on the market.