Discover the Future of New Energy with Innovative Visualization
As the industry shifts towards renewable energy, data visualization can help track and analyze the performance of renewable energy sources such as geothermal, CCUS, and wind farms. This information can help companies optimize their renewable energy investments and identify areas for improvement.
Harness the Power of Your Data
Our data visualization platform, IVAAP, is designed with the needs of energy companies in mind, providing powerful visualization tools that enable you to see your data in new and insightful ways. With customizable dashboards, interactive charts and graphs, and powerful analytics capabilities, you’ll be able to quickly and easily understand your data and make informed decisions about your operations. Whether you’re looking to optimize your wind farm, monitor your geothermal reservoir, or track your CCUS emissions, our platform has the tools you need to succeed. Request a demo today to start harnessing the power of your data to drive your business forward.

Visualizing Carbon Capture, Utilization, and Sequestration
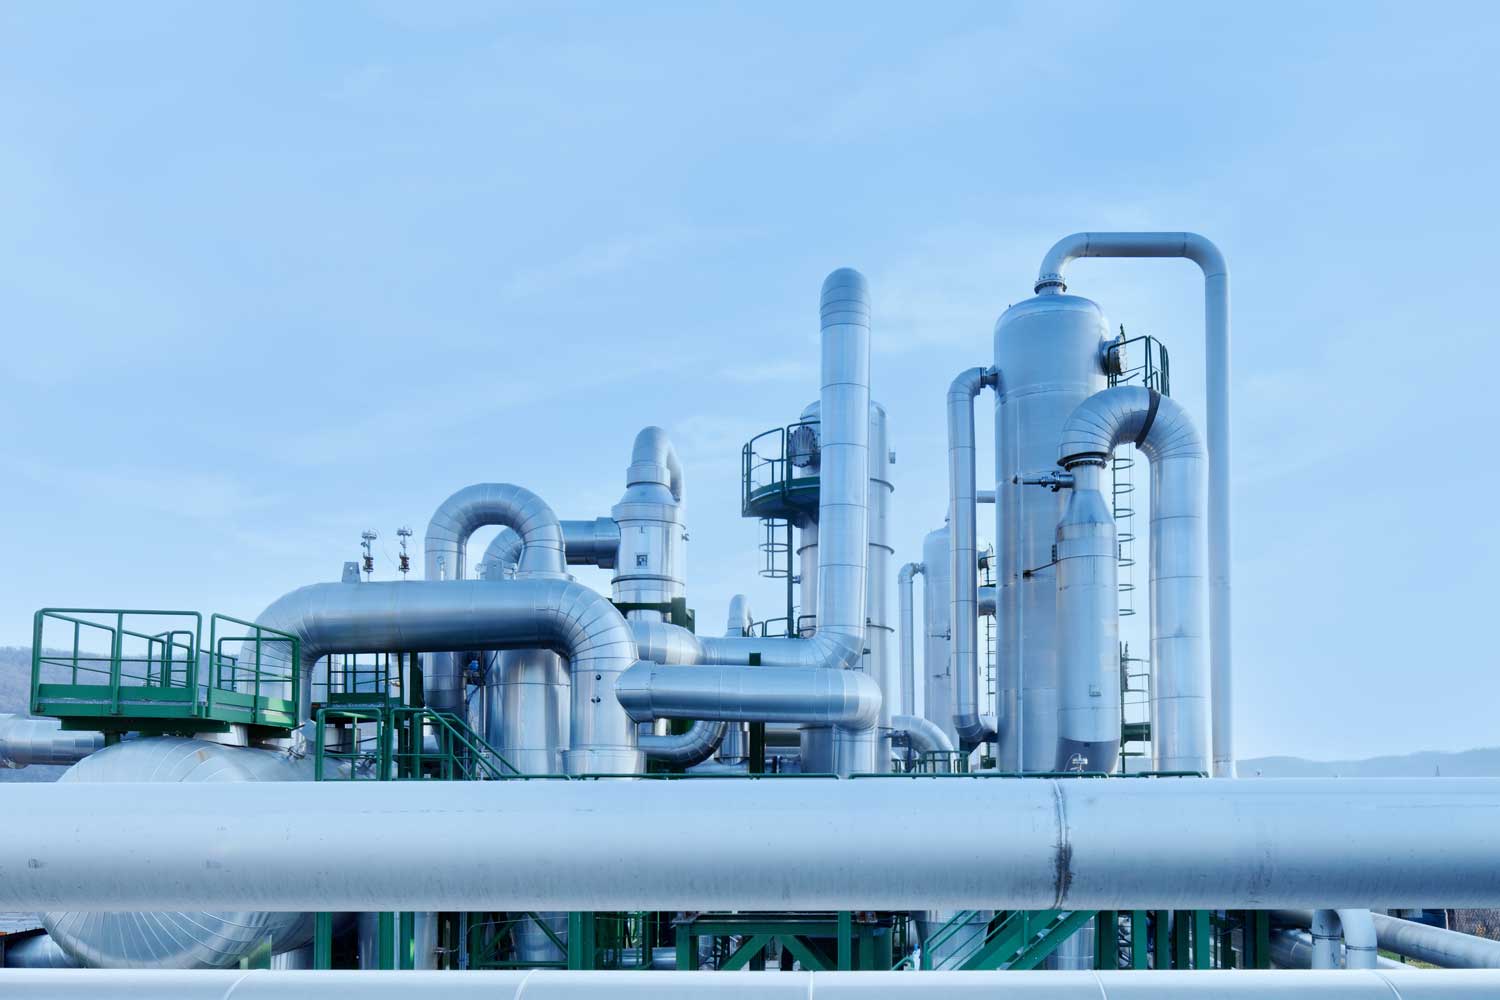
Global demand for new energy sources is quickly growing, and accelerating the deployment of CCUS technology is one renewable energy option. CCUS is not a new process, but by using innovative technology, companies can advance the progress and economic development of developing new energy sources and meeting the goal of becoming carbon-neutral by 2050.

Geothermal Energy Visualization
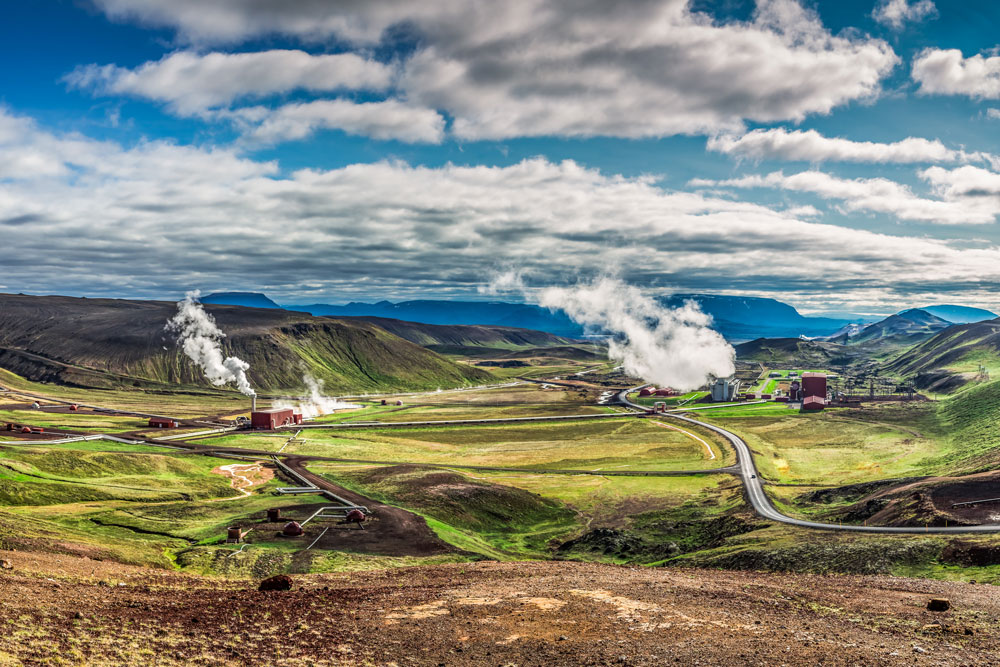
To meet the modern demand for energy consumption, many oil and gas companies are searching for ways to transition and expand quickly and efficiently from traditional energy sources to renewable energy options such as geothermal. But how can companies maximize time, effort, and profitability in order to make this transition feasible?

Wind Energy Visualization
Wind power generation is quickly growing as a renewable energy source that can serve as an alternative to fossil fuel-generated electricity. From advanced analytic solutions that inform planning and forecasting to sighting to steel in the ground to operations, at INT, we want to help you forecast the potential for wind farms, predict the production power of wind projects, and determine the feasibility and potential limitations of a location.
Faster Time to Deploy
Developing a visualization solution from scratch can be expensive and time-consuming, requiring significant investment in software development, hardware, and personnel. By purchasing IVAAP, companies can avoid the upfront costs associated with development and get their applications up and running quickly.
Built to Scale
As companies grow, they may need to scale to handle larger volumes of data and more complex operations. With IVAAP’s back-end and front-end SDKs, companies can leverage the scalability they need to accommodate future growth. IVAAP offers the flexibility to provide visualization now and in the future.
Seamless Integration
To be really powerful, visualization software must integrate easily with other systems and applications, such as data sources, analytics engines, and dashboards. IVAAP offers seamless integration with existing systems and legacy applications, and IVAAP Visualization Components can be embedded in your standalone application.
REQUEST A FREE DEMO
Ready to learn more? Request a free demo to get a personalized walkthrough of our software and learn more about the platform.
