Wind power generation is quickly growing as a renewable energy source that can serve as an alternative to fossil fuel-generated electricity. In the U.S., 8% of energy generating capacity comes from wind turbines—that’s currently more than any other renewable resource—and wind power has more than tripled over the past decade.
From advanced analytic solutions that inform planning and forecasting to sighting to steel in the ground to operations, at INT, we want to help you forecast the potential for wind farms, predict the production power of wind projects, and determine the feasibility and potential limitations of a location.
“As renewable energy grows, wind energy will become the backbone of energy systems in many parts of the world, requiring us to move beyond the focus on simply increasing wind energy capacity…”
—Morten Dyrholm, Chairman, Global Wind Energy Council
Many variables are needed to accurately forecast and predict wind power outcomes such as wind speed, wind temperature, and wind pressure. Additional variables include weather seasonality, production power of wind turbines, and distance from nearby power plants.
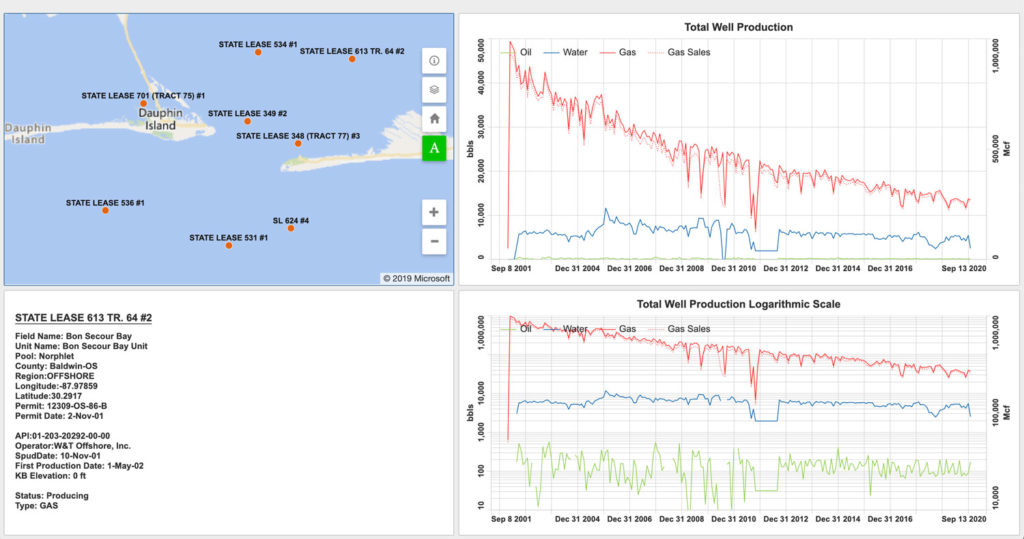
INT provides the technology needed to visualize relevant wind variables necessary to make key business decisions, such as finding optimal wind farm locations, forecasting output, and monitoring operations. INT’s advanced visualization libraries (GeoToolkit) allow developers to display required views—wind temperature, speed, pressure, and more—to directly monitor the data from a wind farm in real time.
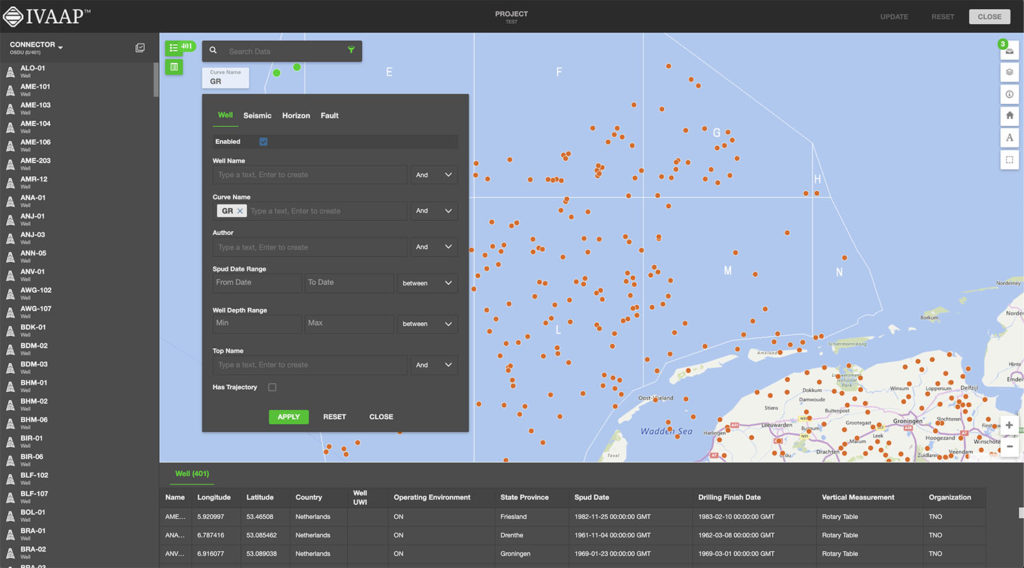
Augment your visualization with customizable, domain-specific libraries with GeoToolkit or leverage IVAAP, INT’s industry-leading domain visualization platform.
For more information about how IVAAP or GeoToolkit can help you visualize your geothermal project, contact us for a free demo.